
Analysis of ORDI Price Breakout and Potential Upside
The recent surge in Bitcoin's value above $70,000 has led to increased demand for altcoins connected to the Bitcoin network. Among these, ORDI has shown a breakout rally signifying a potential price increase.
ORDI Breaks Triangle Pattern
In a bullish turn of events at the end of May, the ORDI price surged by 20% on May 30th, breaking out of a triangle pattern. The bullish trend peaked at the 61.80% Fibonacci level before retesting the 50% Fibonacci and breaking the trendline.
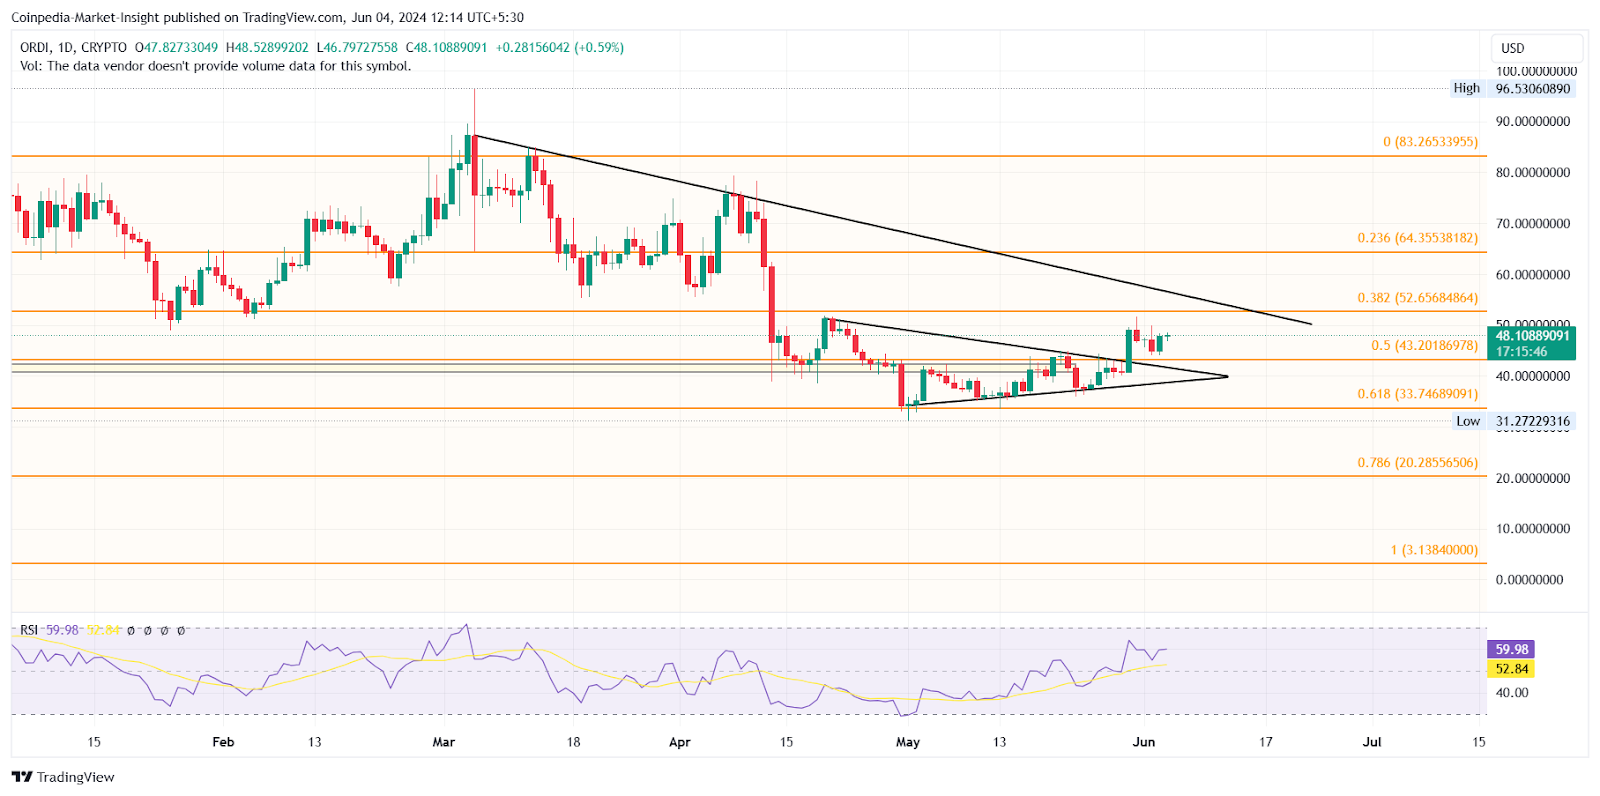
Furthermore, the ORDI price action indicates a possible inverted head and shoulders pattern with a neckline at the 61.80% Fibonacci level. The breakout from the triangle pattern suggests a potential breakout above the $52 neckline.
Currently, ORDI is trading at $48.10, following a 6.42% overnight surge that formed a bullish engulfing candle. The bullish trend is approaching the overhead resistance trendline.
Technical Indicators
-
RSI Indicator: The daily RSI continues to increase and has crossed the halfway mark, indicating a bullish trend.
-
EMA: The price is poised to surpass the 50-day EMA, potentially invalidating the death cross.
Ending Correction Phase?
Despite a previous downtrend, ORDI's price action shows signs of a trendline reversal with the emergence of bullish patterns. A breakout above $52 could lead to a significant upside surge, potentially surpassing the $65 mark in the near future.


Comments