Arweave Price Data Analysis
Recently, Arweave's AR/USD price has surged by 5.68% within a 24-hour period, reaching $45.66. This rise continues a positive trajectory observed over the past week, with a remarkable gain of 21.0% from $37.87 to its current valuation.
The coin has achieved an all-time high of $89.24.
The following chart provides a comparison of price movements and volatility for Arweave over the last 24 hours (left side) and the preceding week (right side).
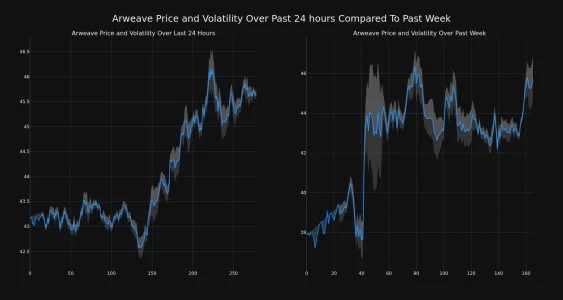
Arweave Price and Volatility Chart
Displayed on the graph are the Bollinger Bands in grey, indicating volatility levels in both daily and weekly price shifts. A broader band or increased grey area signifies greater volatility.
Over the last week, the trading volume for the coin has decreased by 13.0%, concurrently with a 0.43% drop in its circulating supply.
This adjustment brings the current circulating supply of Arweave to 65.45 million units, representing around 99.17% of the maximum supply of 66.00 million.
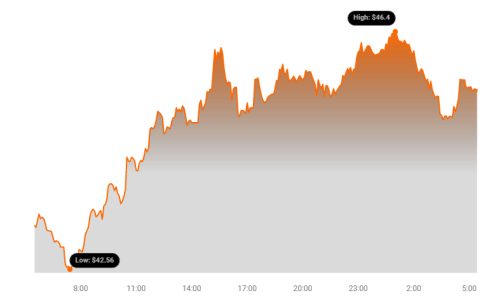
Arweave Price Chart
According to available data, AR is positioned at #44 in terms of market capitalization, with a value of $2.99 billion.
Disclaimer: The information presented should not be used as trading advice. Bitcoinworld.co.in does not hold responsibility for investment decisions based on this content. We recommend conducting thorough research or seeking professional advice prior to making any investment choices.
