
The price of Bitcoin remained relatively stable before embarking on a fresh uptrend, surpassing the $36,000 threshold. BTC managed to climb above $37,000, entering a positive territory to avert further declines.
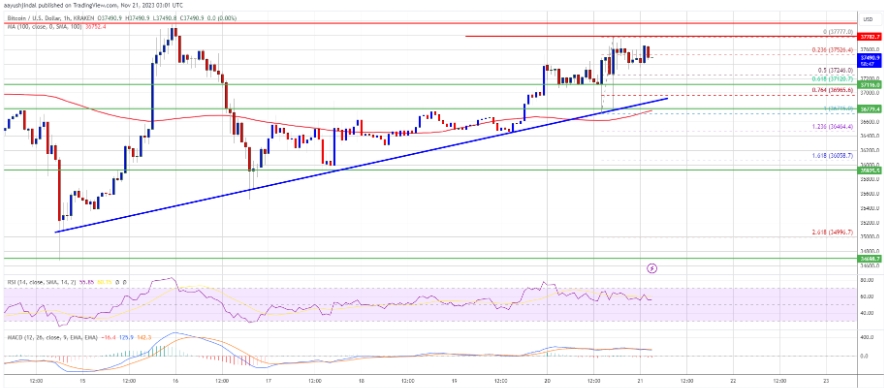
During this upward surge, the price even broke through the $37,350 barrier, reaching a peak around $37,777 before entering a consolidation phase. Currently, it is trading close to the 23.6% Fibonacci retracement level, calculated from the swing low at $36,715 to the high at $37,777.
Bitcoin is currently trading above $37,000, maintaining its position above the 100-hourly Simple Moving Average. Additionally, an important bullish trend line is forming, offering support at approximately $36,950 on the hourly chart of the BTC/USD pair.
Looking ahead, the immediate resistance lies in the vicinity of $37,800, with the primary hurdle remaining at the $38,000 level. Should the price manage to close above this critical $38,000 resistance, it could potentially trigger another robust uptick in Bitcoin's value.
The next significant resistance to watch out for is around the $38,800 mark. If there's a decisive breakthrough above this $38,800 resistance, it may propel the price even higher, potentially reaching the $39,200 threshold. In such a scenario, the possibility of testing the $40,000 level cannot be ruled out. Further gains could potentially push BTC towards the $41,200 level.
Another Downside Correction In BTC?
Should Bitcoin prove unsuccessful in surpassing the resistance zone at $37,800, a potential downward correction may ensue. Immediate support to watch for on the downside can be found around the $37,120 level, or alternatively, at the 61.8% Fibonacci retracement level, which is calculated from the upward move starting at the $36,715 swing low to the $37,777 high.
The subsequent significant support level is at $37,000, coinciding with the established trend line. If the price descends below the $37,000 mark, it introduces the possibility of further declines. In such a scenario, there's potential for a drop towards the nearby support at $36,780 in the short term. Beyond that, the next critical support level or target could be identified at $36,200.
Analysis of Technical Indicators:
Hourly MACD – The MACD indicator is currently showing signs of slowing down within the bullish zone.
Hourly RSI (Relative Strength Index) – The RSI for the BTC/USD pair is presently above the 50 level.
Key Support Levels – The primary support levels to monitor are $37,120 and $37,000.
Key Resistance Levels – Noteworthy resistance levels to be aware of include $37,800, $38,000, and $38,800.