The cryptocurrency market, which had previously seen tremendous increase as we entered October, is currently exhibiting signs of reversal. Because they pay close attention to US macroeconomic indicators and the SEC's potential future measures, Bitcoin investors in particular are struggling with fear and uncertainty in the cryptocurrency market. While some analysts are looking forward to a positive resurgence starting, others are preparing for a significant downturn.
Bitcoin Daily Chart Analysis
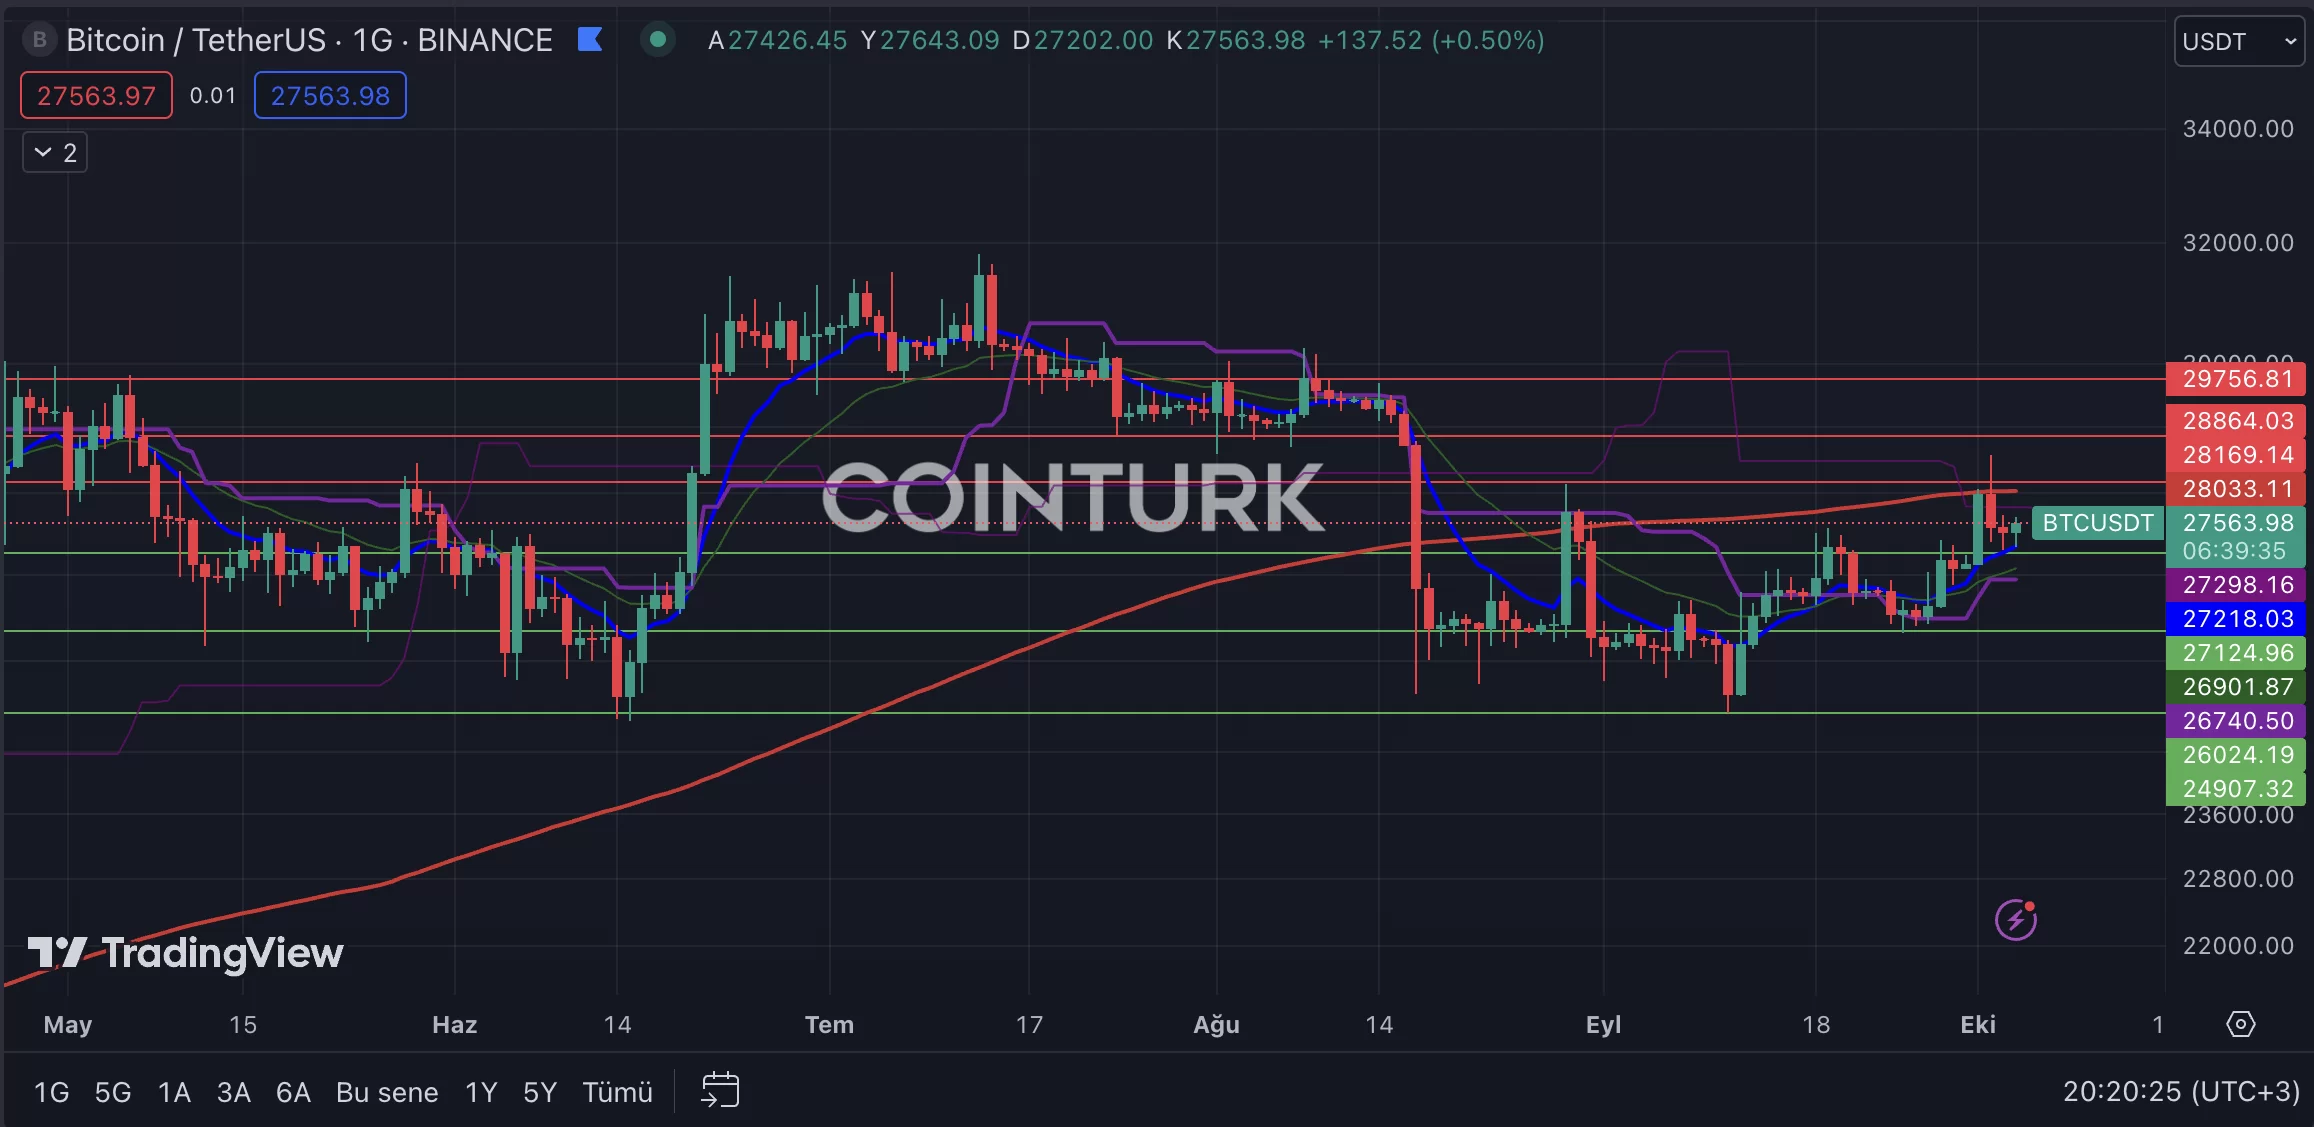
Analyzing Bitcoin's daily chart reveals no distinctive patterns. However, its prolonged sideways movement over nearly six months highlights its price stability and investor caution. Recent instances of Bitcoin encountering resistance at the EMA 200 moving average during two recent rallies suggest this level acts as strong resistance, signaling a bearish scenario.
Key support levels on the Bitcoin chart are $27,124, $26,024, and $24,907. The significance of the $24,907 level is underscored by its role in critical moments. A daily closing price below this level could lead to Bitcoin revisiting recent lows.
Important resistance levels to watch on the chart include $28,169, $28,864, and $29,756. Recent trends indicate that a daily closing price above $28,169 would enable Bitcoin to surpass the EMA 200 and break a significant resistance barrier.
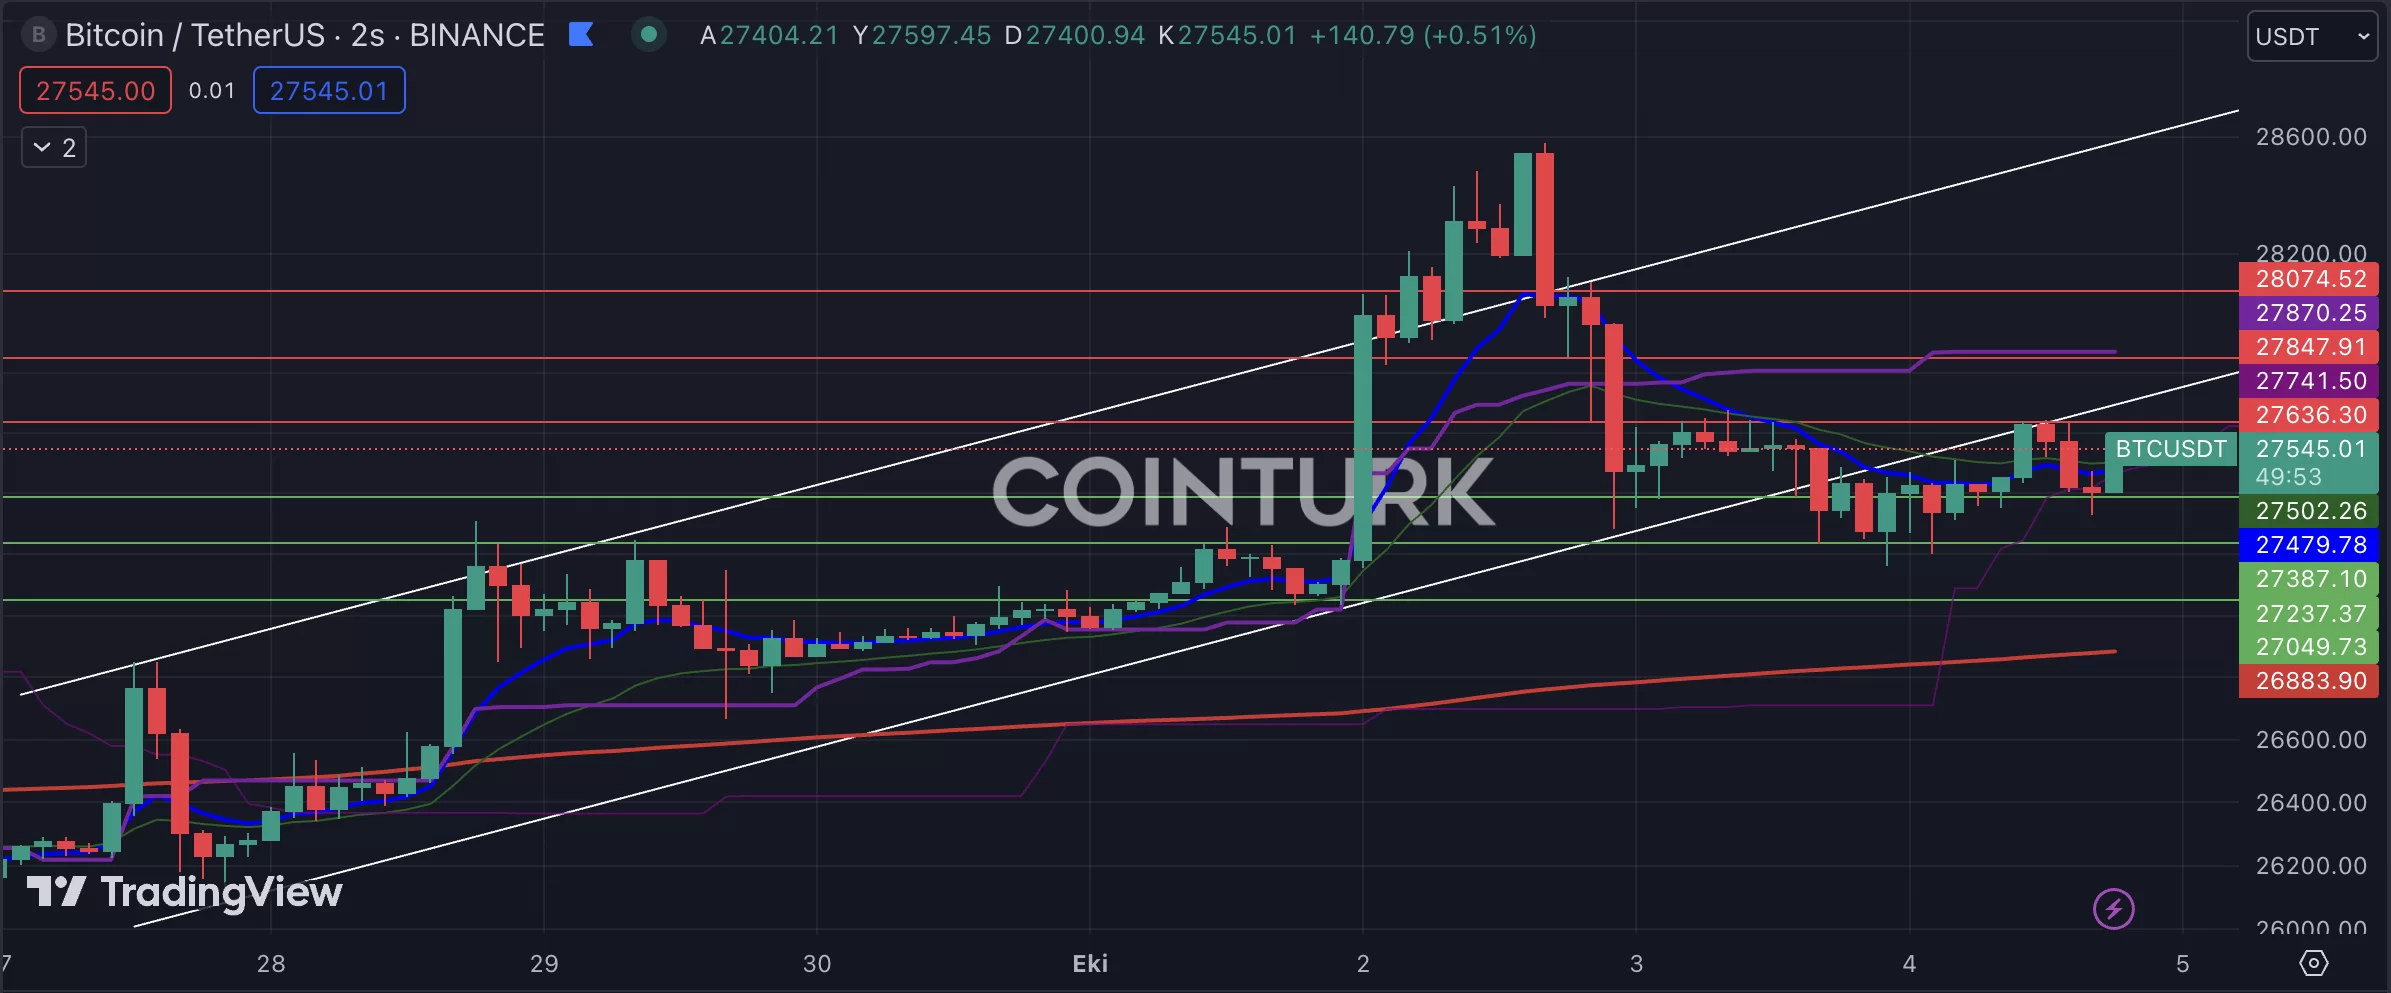
Bitcoin Two-Hour Chart Analysis
In the two-hour chart, significant for futures traders, Bitcoin's recent rise occurred within an ascending channel. However, recent price declines broke the formation's support. Bitcoin's inability to re-enter the channel after several attempts may result in a notable price drop, though positive news could reverse this trend.
Critical support levels in the two-hour chart include $27,387, $27,237, and $27,049, with particular attention to the $27,237 level, as a closure below it may accelerate the decline.
On the flip side, noteworthy resistance levels to monitor on the chart are $27,636, $27,847, and $28,074. A two-hour bar closure above $27,636 would allow Bitcoin to re-enter the channel and break the resistance level.