Historical Price Trends
Bitcoin has exhibited cyclical patterns of rapid growth followed by corrections, crucial for predicting future market trends. The price chart against the US Dollar from 2010 to predicted prices in 2025 shows a significant rise from under $1 to over $100,000 by 2025, reflecting the substantial growth of Bitcoin over the years. Resistance levels, denoted by blue horizontal lines, represent Fibonacci levels where Bitcoin faces resistance before moving to the next level. Understanding these resistance levels is key to grasping the cyclical nature of Bitcoin's price movements, characterized by periods of high volatility followed by corrections or sideways movements.
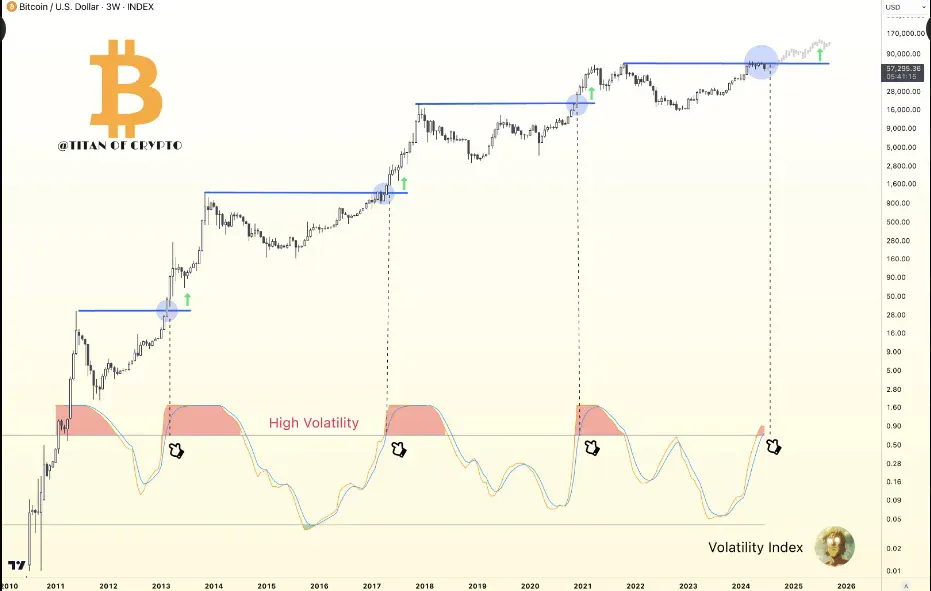
Source: Titan of Crypto
Volatility Patterns
The volatility index beneath the price chart tracks Bitcoin's price volatility over time, with high volatility periods indicated by red shaded areas. These high volatility periods appear cyclically and typically precede significant price movements, suggesting that periods of high volatility could signal the onset of a new bull market phase for Bitcoin.
Recent Market Movements
Recent market movements show a decline in Bitcoin's price from around $58,000 to approximately $55,190, indicating considerable volatility. This decrease, accompanied by irregular price movements, may be influenced by external events such as Mt. Gox's significant Bitcoin movement, German government withdrawals, and Bitcoin miner sell-offs. These events can impact market sentiment and lead to short-term price fluctuations.
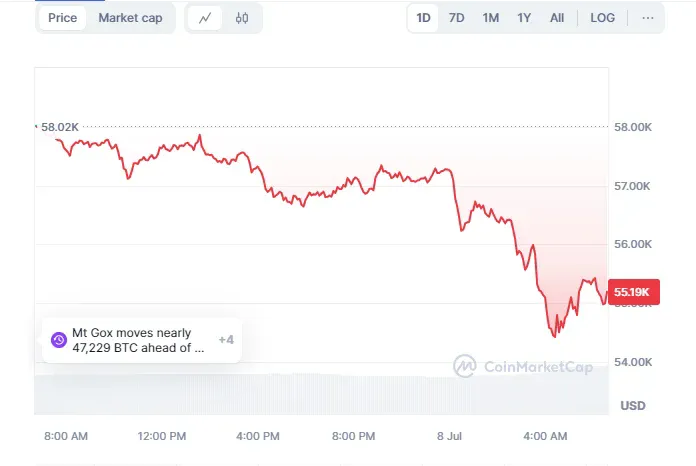
Source: CoinMarketCap
Despite short-term bearish trends, market analysts project that Bitcoin could potentially reach $150,000 by the end of the year, showcasing long-term optimism and positive predictions for Bitcoin's future price movements. These projections align with a general optimistic outlook within the crypto community, emphasizing the importance of historical price trends and volatility analysis in predicting future market movements and aiding investors in making informed decisions.
