
As Bitcoin's bullish momentum continues after retesting the $65,000 mark, the market begins to see signs of relief. Despite the ongoing correction phase, the PEPE meme coin shows potential for a price surge.
As interest in a possible recovery grows, the meme coin presents an opportunity for entry at a discounted rate. Will the PEPE price reach $0.000015 this month? Explore further insights in the PEPE price prediction.
PEPE Price Trend
During a market-wide slowdown, meme coins like PEPE exhibit a declining price trend. Following a significant bull run in March, the second half of the month witnesses a rapid decline in bullish momentum.
The price of PEPE falls by 33% to test the support zone at $0.0000063 from the peak of $0.000010. Increased selling pressure results in the formation of a descending trendline in price action.
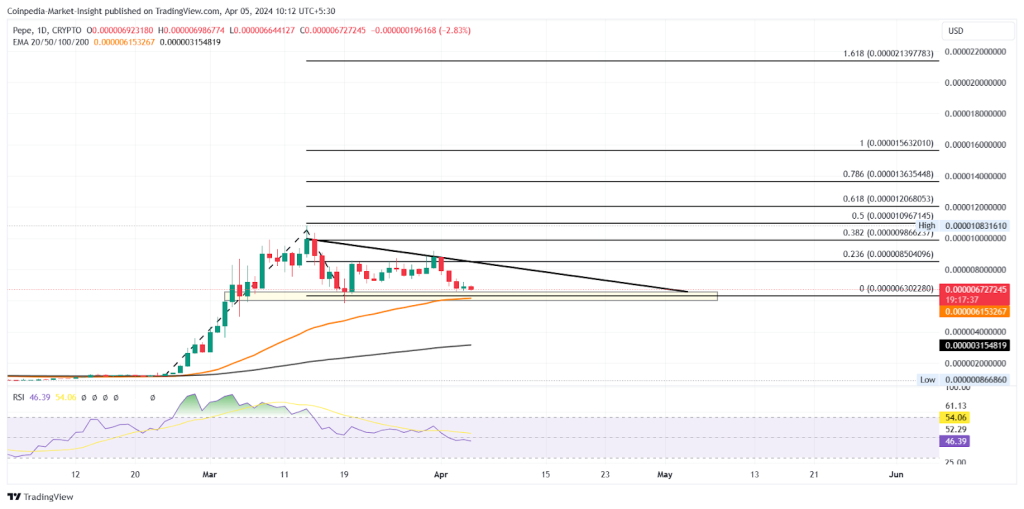
Analysis on TradingView.
Considering the previous bull run, the pullback forms a bullish flag pattern, indicating a possible continuation of the trend. Additionally, the resurgence of Bitcoin and the forthcoming Bitcoin halving support the idea of an altcoin season.
Currently trading at $0.0000067, the PEPE token displays a Doji candle pattern on the intraday chart, hinting at potential bullish momentum with a morning star formation.
Technical Indicators
- EMA: The 200 and 50-day exponential moving averages (EMA) maintain a positive alignment, with the 50-day EMA acting as dynamic support and hinting at a potential bounce back.
- RSI: The daily Relative Strength Index (RSI) indicates a decline below the halfway line, with the 14-day Simple Moving Average (SMA) acting as a dynamic resistance level.
Potential Flag Breakout for PEPE Token
With several bullish factors at play, there is a strong likelihood of a reversal for the PEPE token. The price may surpass the overhead resistance trendline for a push towards the $0.000015 mark, though buyers will need to overcome the supply barrier at $0.000010.


Comments