The market is starting the weekend on a bearish note, as reported by CoinMarketCap.

XRP/USD
XRP's price has decreased by 2.13% compared to the previous day.
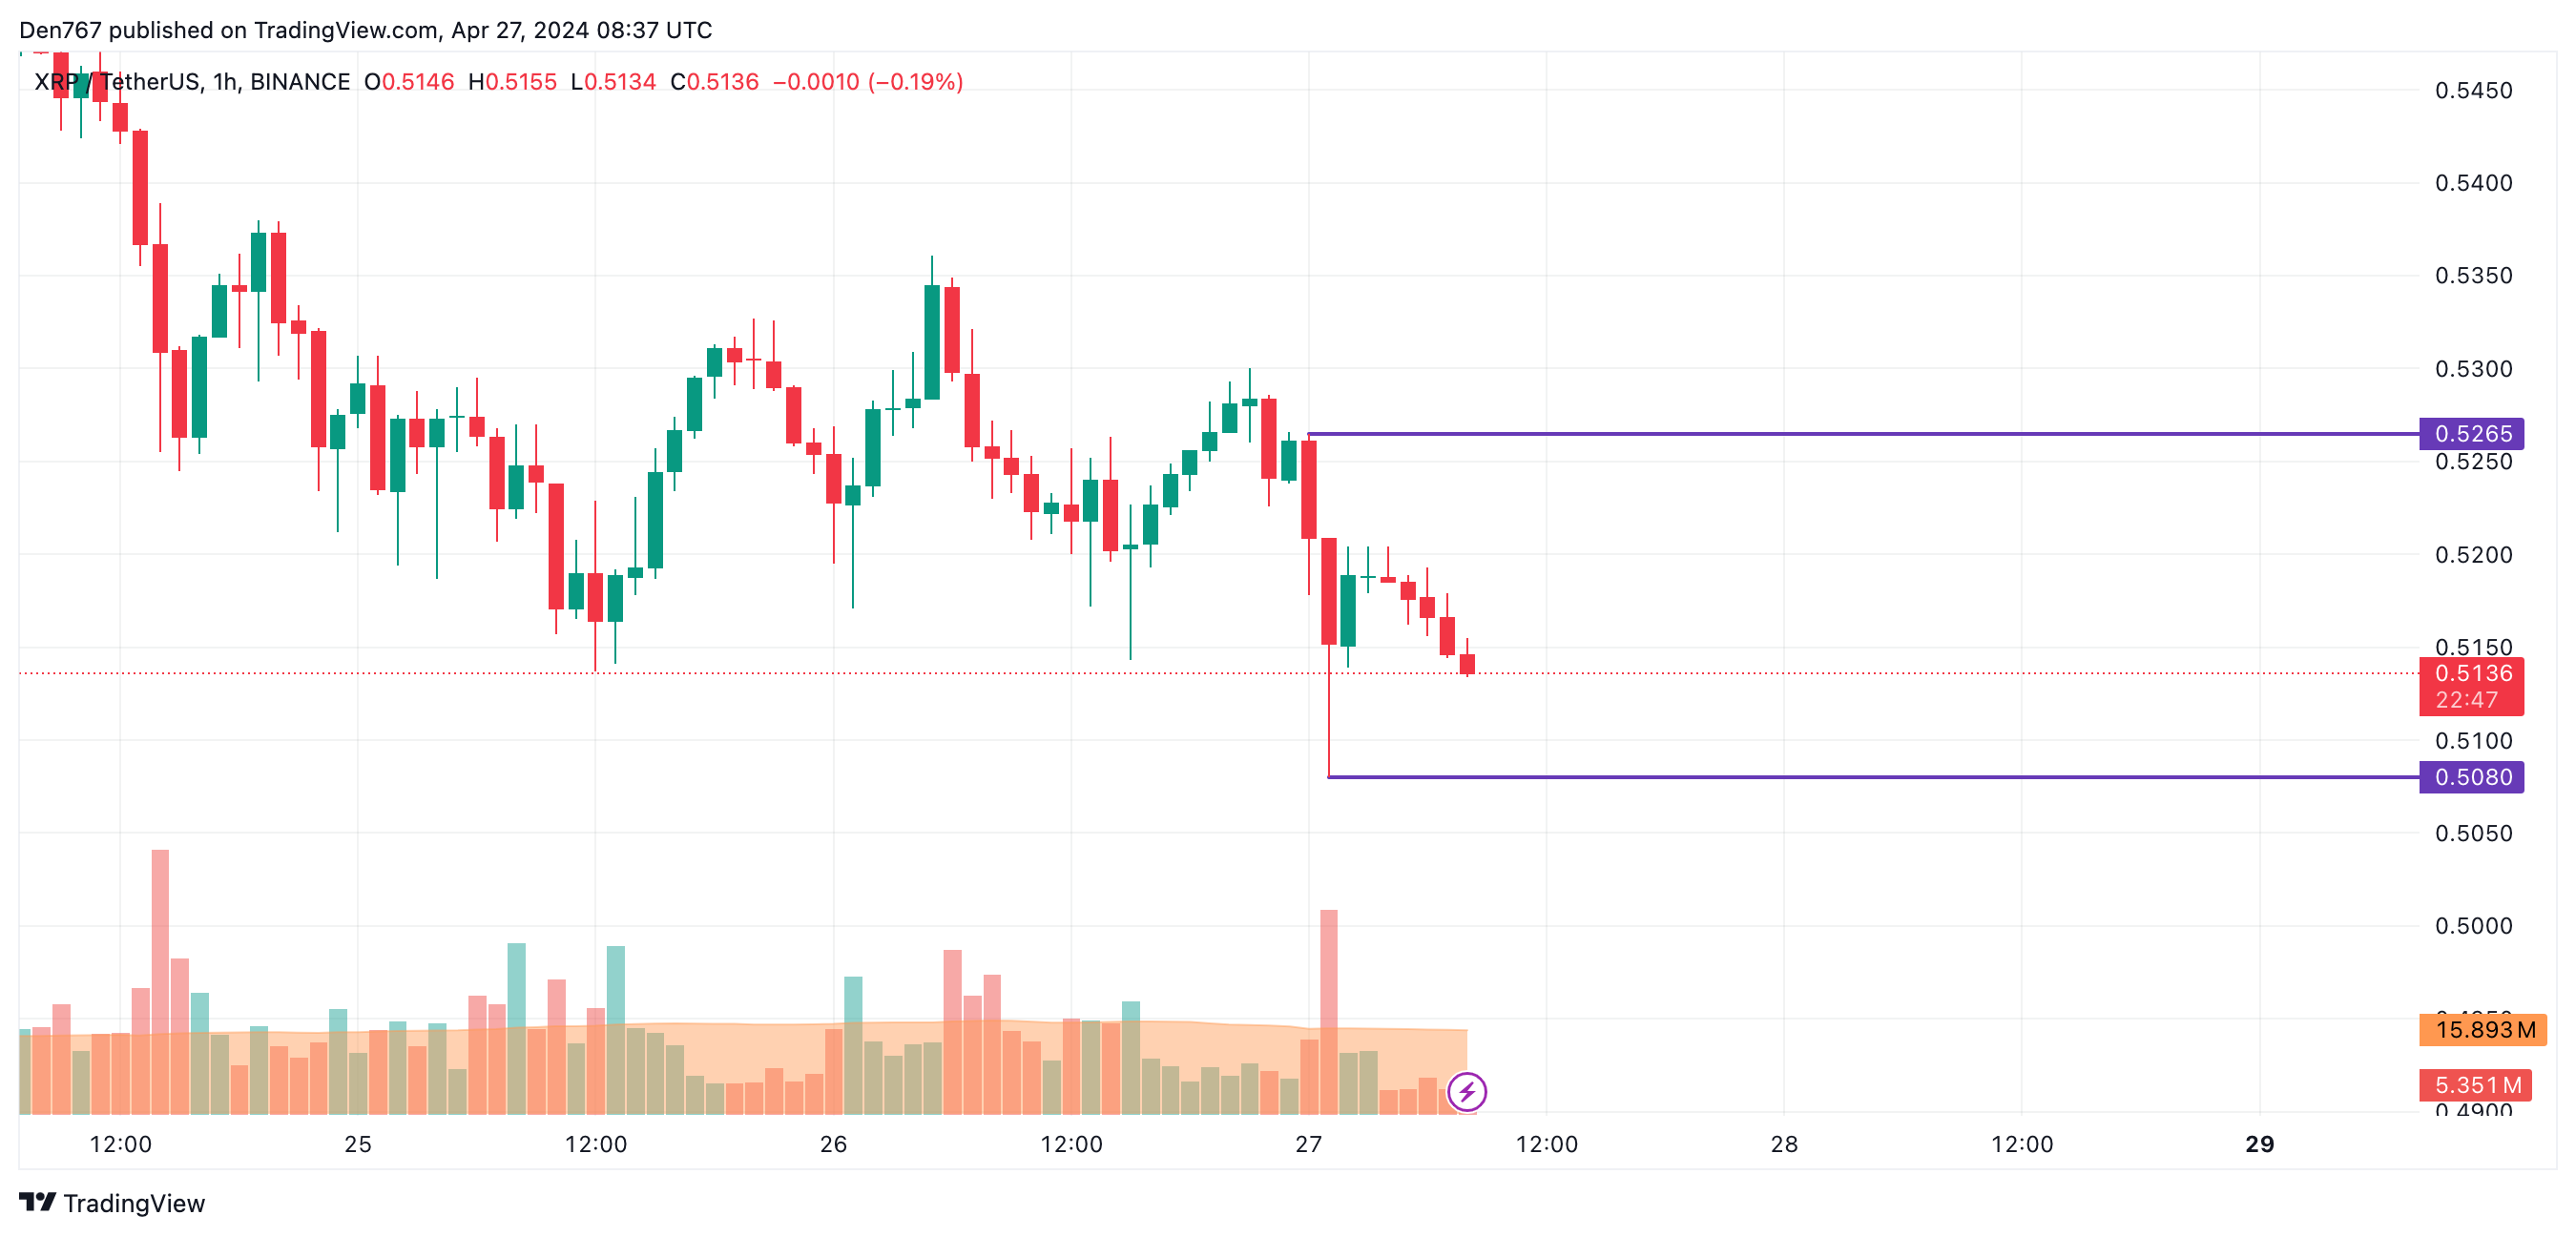
Analyzing the hourly chart, XRP's rate is currently positioned between the support level of $0.5080 and the resistance level of $0.5265.
The trading volume continues to decline, indicating that significant price fluctuations are unlikely to occur before the day ends.
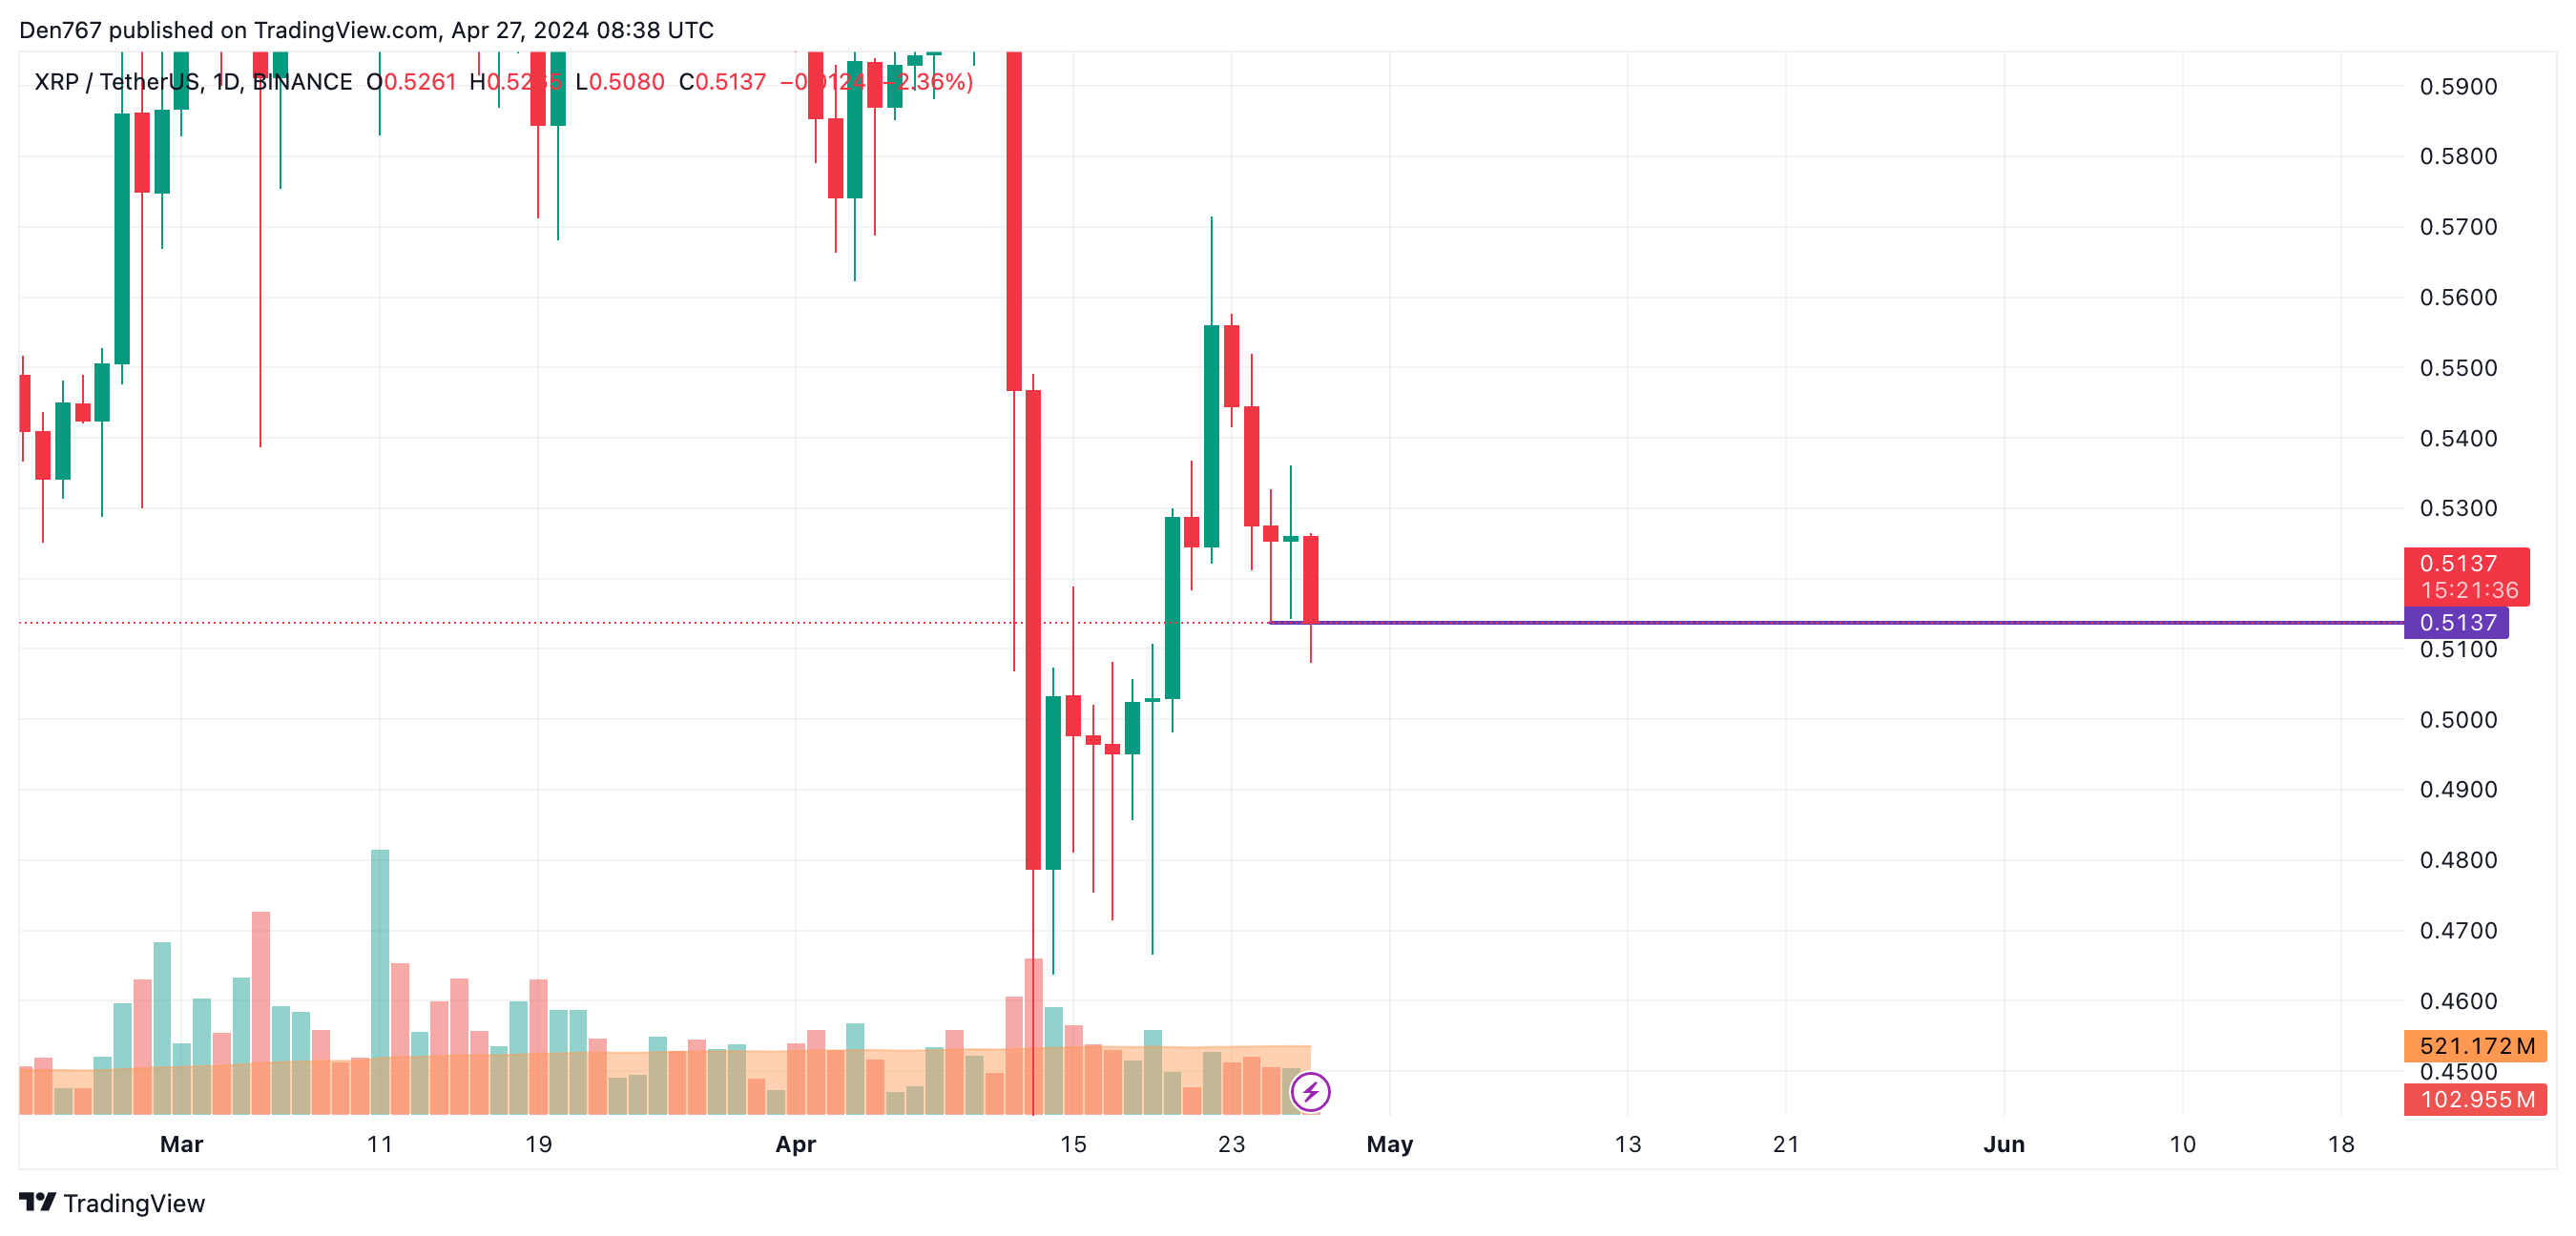
On the daily timeframe, traders are advised to monitor the closure of the bar. If the closure happens near or below the support level of $0.5137, there is a high probability that the decline will extend towards the critical zone of $0.50 soon.
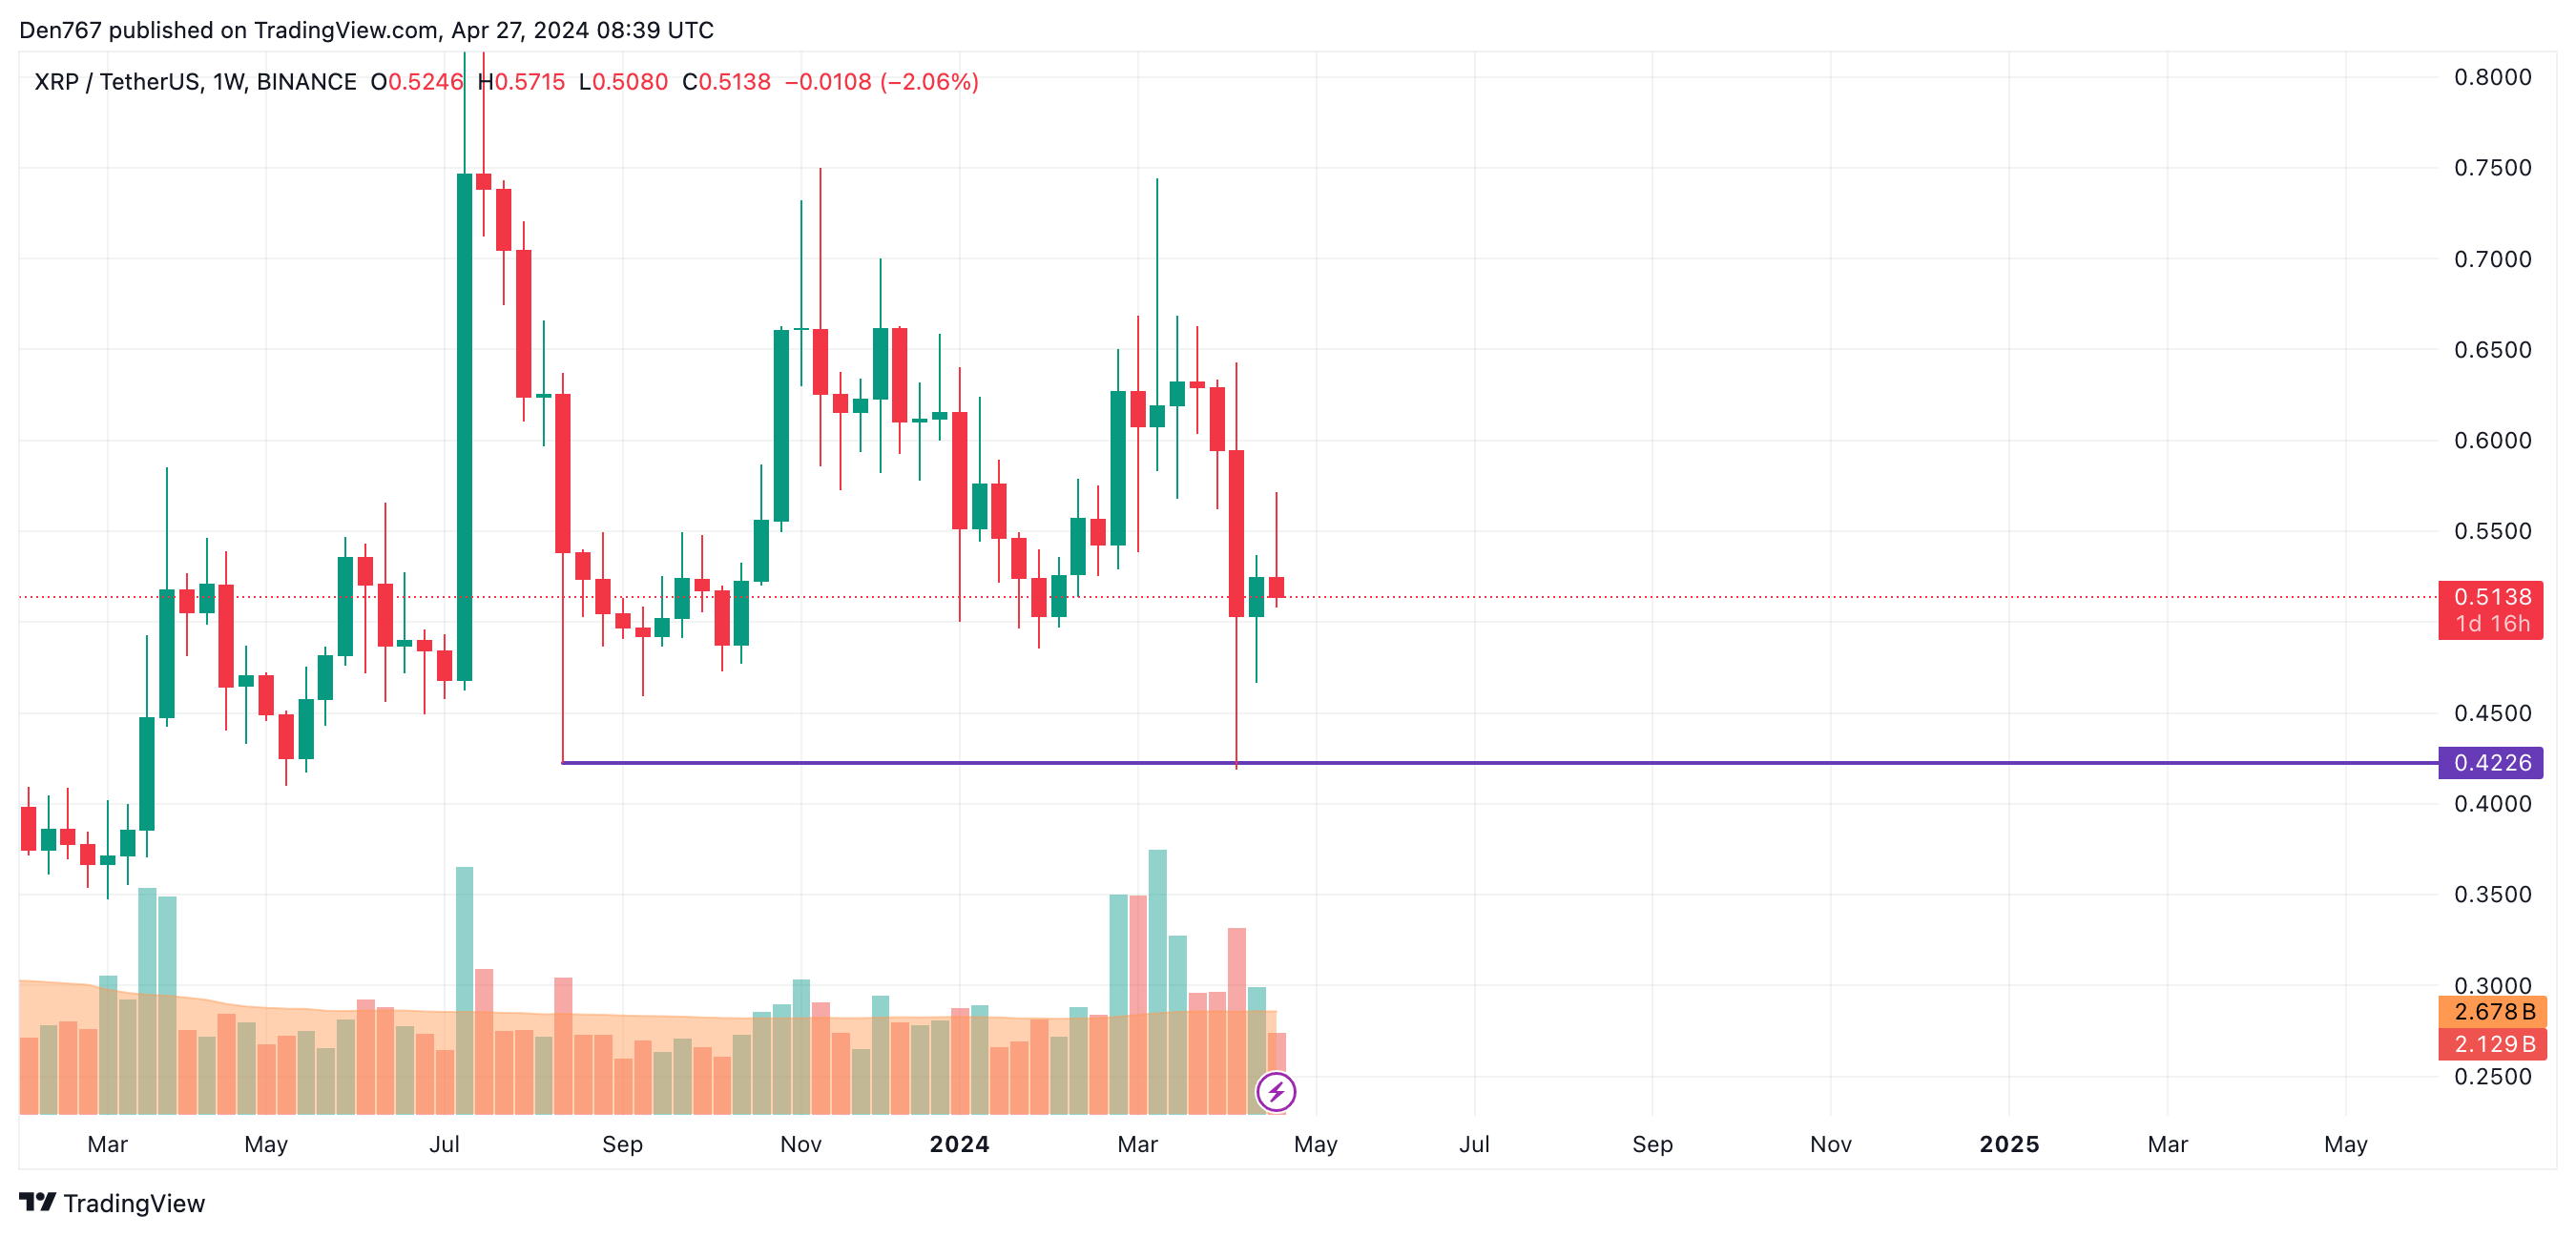
Looking at the technical aspect, the weekly bar is on track to close in a bearish manner. Unless the bulls take control, there is a chance for a test of the $0.45-$0.50 range in the early days of the upcoming month.
At the time of writing, XRP is trading at $0.5148.
