
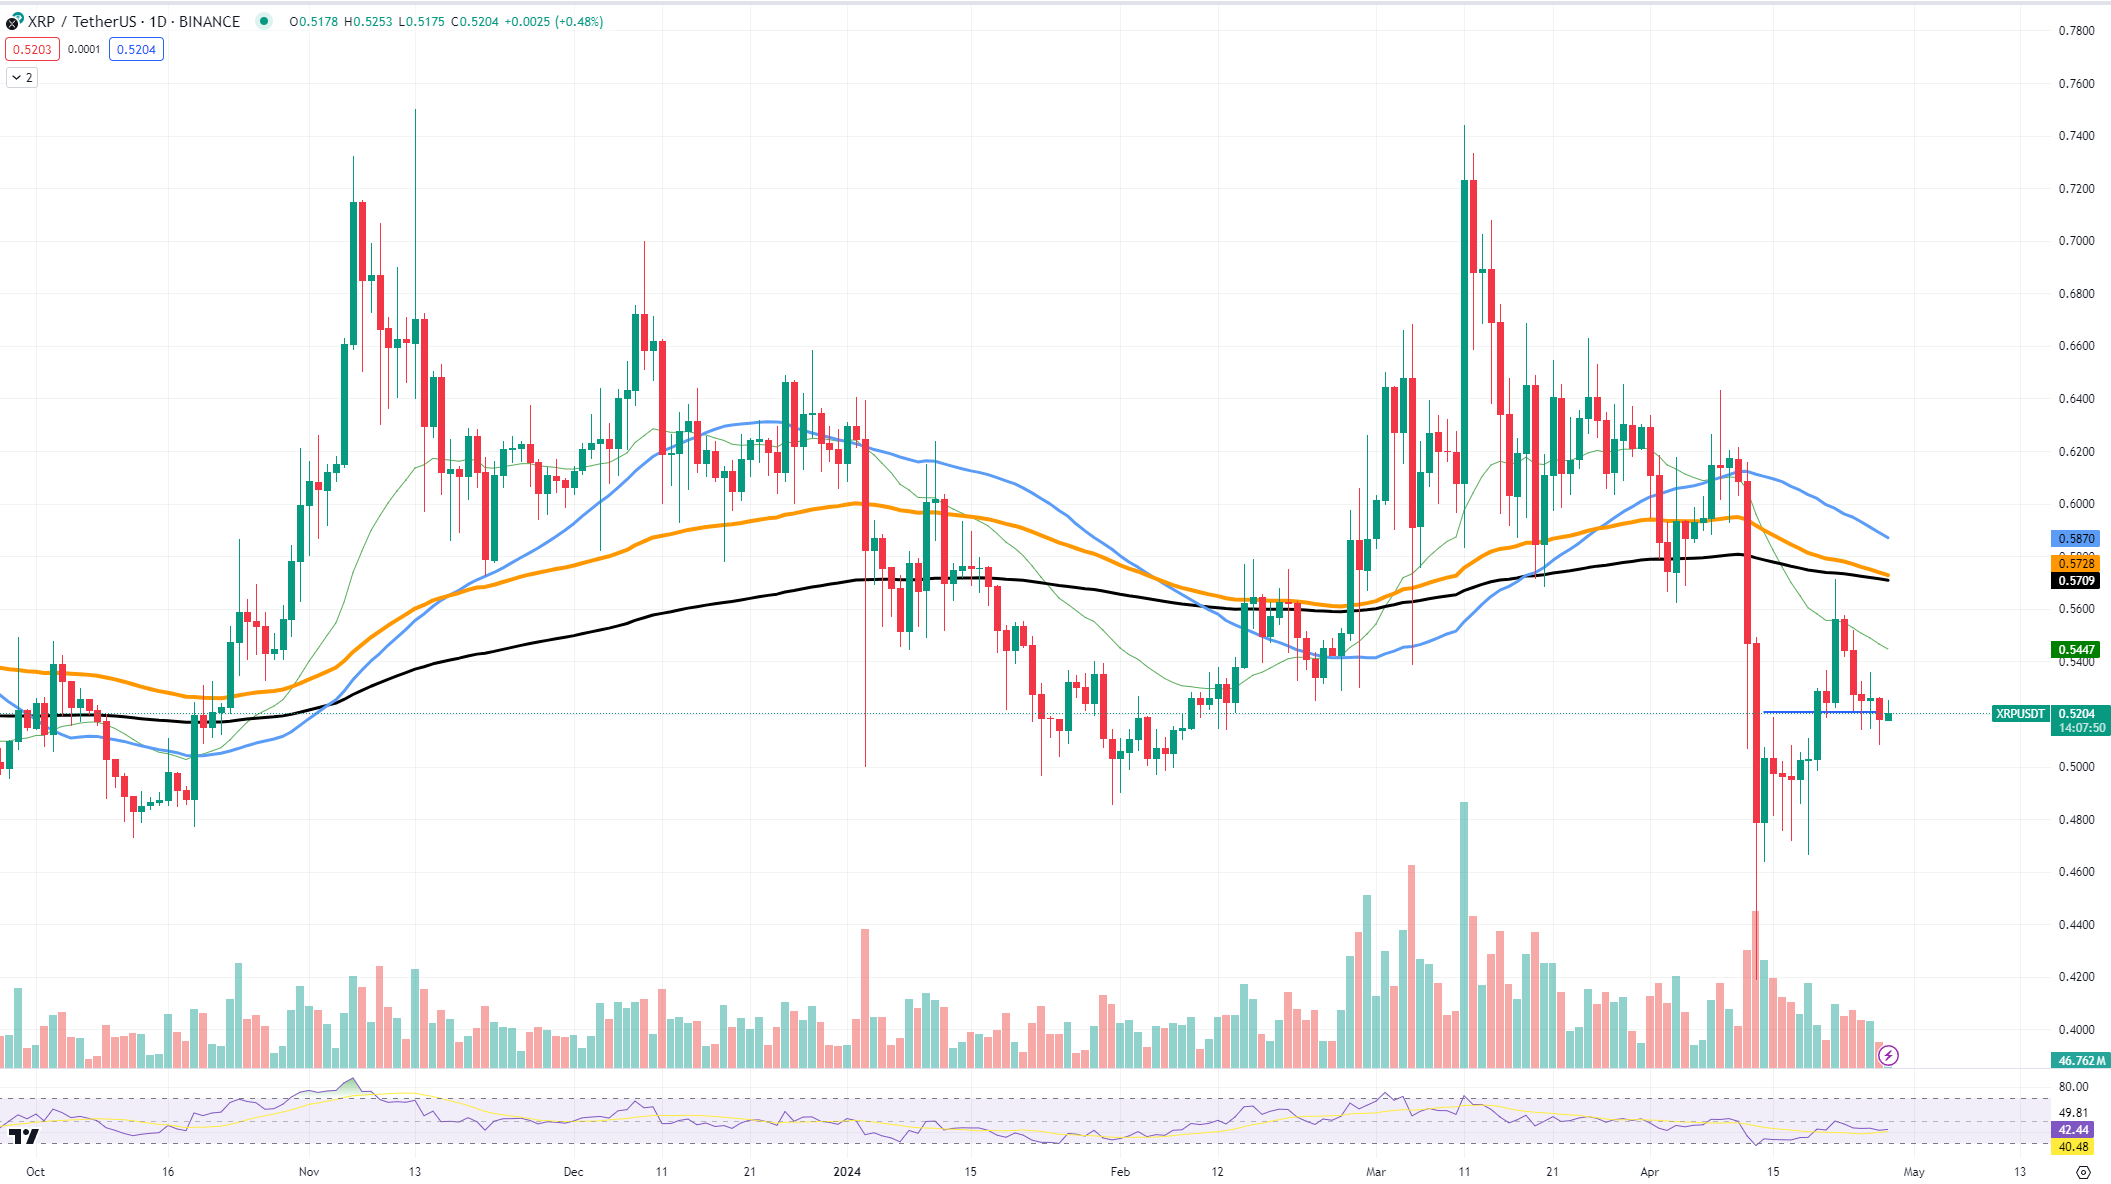
Recent movement in the XRP chart shows a potential reversal in price with the appearance of a green daily candlestick. This change is seen as a positive signal for a short-term shift in market perspective, despite a decrease in trading volume. Analysts are wary of the reliability of this price change due to the lack of strong conviction in the market. A significant factor to watch out for is the potential crossing of the 100 and 200-day Exponential Moving Averages (EMA), which could indicate a shift in market momentum. A bearish outlook is expected if the 100-day EMA moves below the 200-day EMA.
Looking ahead, a possible crossover of the 50 and 200-day EMA in the coming months could signal a more sustained downward trend for XRP, confirming a long-term bearish sentiment. Currently, XRP is testing a support level near $0.52, with a potential climb towards $0.5728 if this support holds. However, failure to maintain the support level could result in a decline towards lower support zones, potentially around the psychological level of $0.5000. Traders are advised to exercise caution given the uncertain market conditions, as the light trading volume and impending EMA crosses suggest a possible upcoming price reversal that could lead to significant losses.


Comments