

The price of Polkadot cryptocurrency (DOT) has experienced a decrease of -0.20% over the past week. Currently trading at $5.25, the DOT price has dropped by 0.20% within the last 24 hours. The market capitalization of DOT stands at $6.25 billion. The recent price trends indicate a bearish momentum and a potential downtrend in progress.
Analyzing the price data of Polkadot, it can be observed that it is currently in a downtrend phase. Having reached a peak of $54.98 within the past 52 weeks, the price has since declined significantly to its current level of $5.25.
The cryptocurrency's performance over the year has been lackluster. While it initially yielded positive returns of 15.78% at the beginning of the year, these gains diminished over time. In the past six months, DOT recorded a negative return of -6.03%, and in the last month, it saw a decline of -8.44%. Over the past seven days, the price also dropped by -0.20%, emphasizing a prolonged bearish trend.
Polkadot (DOT) has undergone price drops in recent months, but it is currently attempting to recover from its present level of $4.99. If the price manages to hold steady, there's a possibility of it climbing to the first and second targets of $5.57 and $6.04, respectively. However, failing to maintain this level could result in a decline towards the nearest support levels of $4.81 and $4.52.
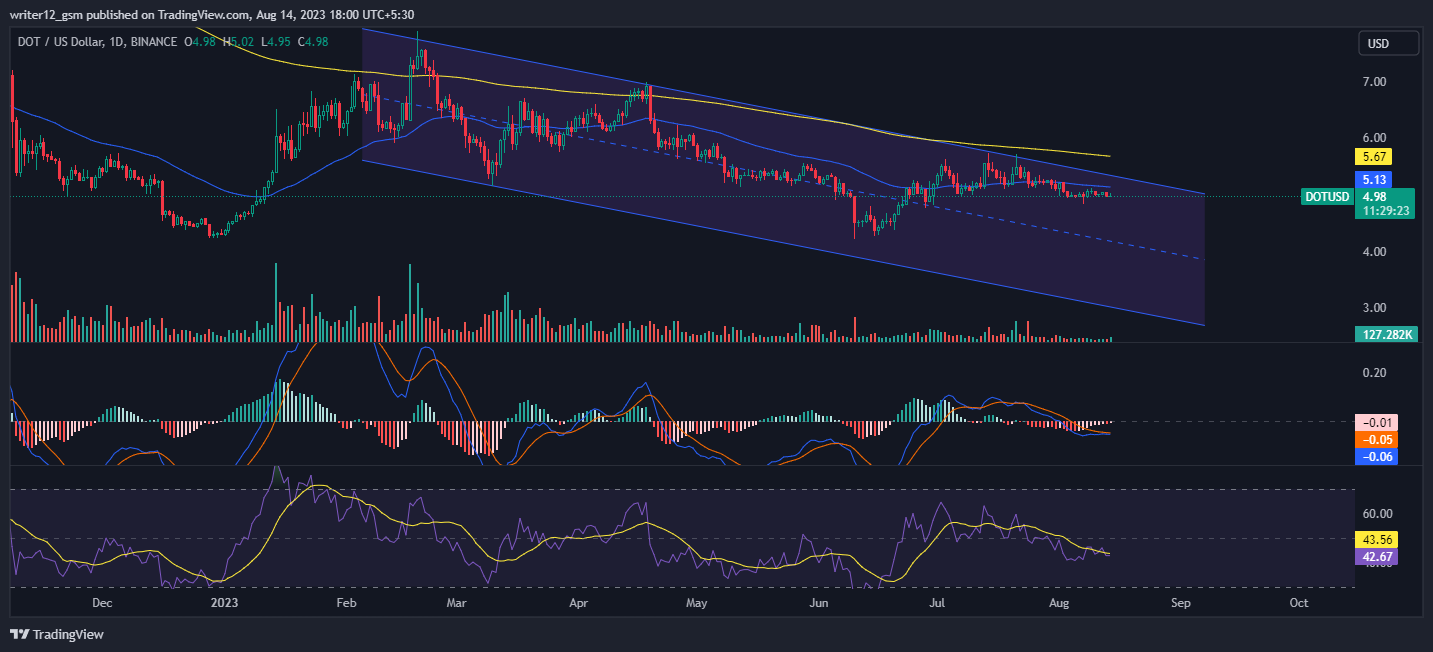
A potential scenario involves selling volume accumulating, leading to the price breaking through supporting simple moving averages (SMAs) by forming lower highs and lows. Consequently, the DOT price is anticipated to move downwards, strengthening the bearish sentiment according to the daily time frame chart.
Technical analysis of Polkadot's cryptocurrency reveals key indicators for its price movement in 2023. Currently, the DOT price is positioned below the 50-day and 200-day SMAs, indicating a prevalent downtrend. The Relative Strength Index (RSI) stands at 42.67 points, while the 14-day SMA is above the median line at 43.56 points, both pointing towards a bearish outlook.
Furthermore, the Moving Average Convergence Divergence (MACD) displays a bearish crossover, with the MACD line at -0.06 and the signal line at 9.35, both positioned below the zero line. This crossover suggests a higher potential for further bearish movement in the price of DOT cryptocurrency.
In summary, the current price action and technical indicators signify a bearish sentiment among investors and traders within the 1-day timeframe. The analysis emphasizes a downward trend, supported by the MACD, RSI, and EMA indicators, suggesting that the negative price trend may persist for DOT cryptocurrency.
Technical Levels: Support Levels: S1 $4.81, S2 $4.52 Resistance Levels: R1 $5.57, R2 $6.04


Comments