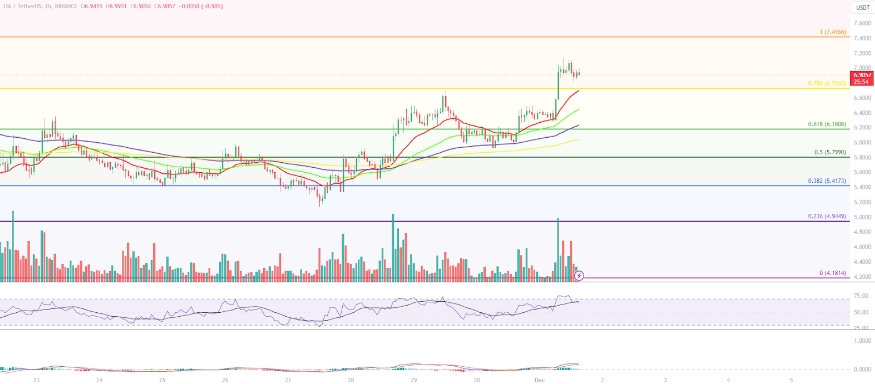
Currently, MATIC is actively trying to overcome a significant resistance level at $0.89. If this breakthrough succeeds, it may confirm a trend change in favor of the bulls.
Over the past five days, the price of Polygon has significantly increased, reaching the Fibonacci level of 0.382 at $0.821.
If MATIC successfully breaks above this resistance, the next potential target could be the golden ratio level, around $0.89. Breaking above this level would open the path for the asset to reach the previous local high at $0.98.
Furthermore, on the daily chart, the MACD (Moving Average Convergence Divergence) lines are forming a bullish crossover. The MACD histogram has been showing upward momentum for several days, and the Relative Strength Index (RSI) is currently in the neutral zone.
The Exponential Moving Averages (EMA) have formed a "golden cross," confirming the presence of a short-term and medium-term uptrend.
Technical indicators provide mixed signals
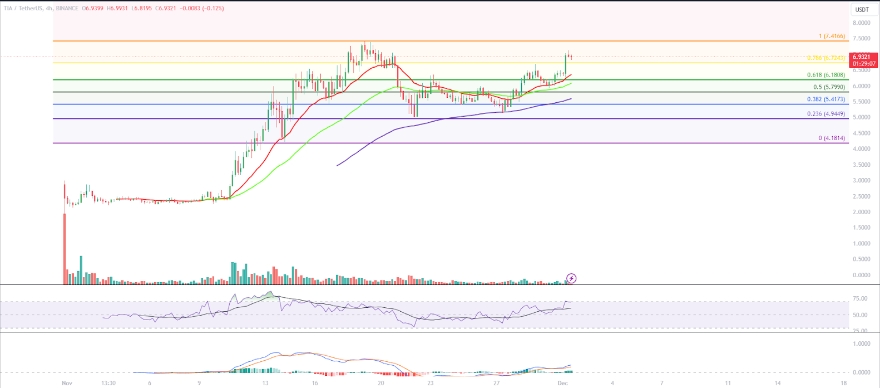
On the 4-hour chart, MATIC also experienced a golden crossover of exponential moving averages, confirming a short-term bullish trend. However, it should be noted that the RSI is approaching overbought levels, and the MACD histogram is showing signs of decreasing.
These indicators suggest that there is potential for a future bearish crossover of the MACD lines. In such a case, a breakout of the $0.821 level may turn out to be false, and the price of Polygon may find support at the horizontal level around $0.7624.
Weekly timeframe analysis does not provide clarity. The medium-term trend is still bullish, confirmed by the golden crossover of EMA. However, the RSI is currently in the neutral zone, and the MACD histogram hints at a possible correction.
Despite mixed indicators, MATIC still has the potential for growth. However, to achieve this goal, it needs to firmly establish itself above the important support level at $0.67.
MATIC Price Forecast: Confirmation of Reversal and Further Growth
On longer timeframes, a bullish trend that started in October is strengthening. However, the MACD lines continue to intersect with a bearish bias, and the Relative Strength Index remains in the neutral zone.
Despite these mixed signals, MATIC has already formed three consecutive monthly bullish candles. This consistent upward momentum may potentially indicate the beginning of a trend change.
To confirm the trend change, Polygon must successfully overcome two important resistance levels - $0.975 and $1.2.


Comments