

AI tools helped gather research and write the first draft of this article. I edited it and checked every rule and quote against the page it comes from, listed at the end. The cover illustration is AI-generated. Details at the end.
An author who publishes one article and shares it on X, LinkedIn and Telegram has, by default, four analytics screens to look at: one per platform and one for the website. Add Search Console and it is five. Each screen offers dozens of figures, each uses its own words, and each keeps its history for a different length of time.
The usual result is one of two habits. Either the author checks everything every day and learns little, or checks nothing and keeps only an impression of what "did well".
A dashboard for one author can be much smaller than any of those screens: five numbers per post, read twice on fixed days, written into one spreadsheet that the author owns. This article sets out which five, how often to read them, where to keep them, and why each choice follows from what the platforms' own documentation says about their data.
This is part 7 of the Platforms & Metrics series. Part 5 explained why view counts from different platforms cannot be added or ranked, and part 6 who can see which numbers and for how long. This part takes both as given and turns to the routine: what to write down, and when.
Start from the questions, not the metrics
A dashboard is only useful if each number on it answers a question whose answer could change what the author does next. For a person writing articles and sharing them, three questions cover most decisions:
- Did the post bring readers to the article? This decides whether a channel is worth the time spent adapting a piece for it.
- Did those readers stay? A visit that ends in a few seconds is not the same result as a visit that reads on.
- Is the article found later, without a post? An article that keeps drawing readers from search months after the post is worth updating; one that does not depends entirely on distribution.
A fourth question is often asked, "Is my audience growing?", but it is a slower one. A follower count read once a month answers it; read daily it mostly shows noise.
Anything that answers none of these questions can stay on the platform's own screen. The author can still look at it there out of curiosity. It does not need a column.
The five numbers
| # | Number | Where it comes from | Unit | When to read |
|---|---|---|---|---|
| 1 | The platform's own reach figure | Each platform's analytics | That platform's definition | Once, at a fixed age |
| 2 | Replies or comments | Each platform | Count of messages | Once, at a fixed age |
| 3 | Tagged visits to the article | Website analytics, by utm_source | Sessions | Once, at a fixed age |
| 4 | Engaged visits among them | Website analytics | Engaged sessions | Same reading as 3 |
| 5 | Search clicks to the article page | Search Console | Clicks | Monthly |
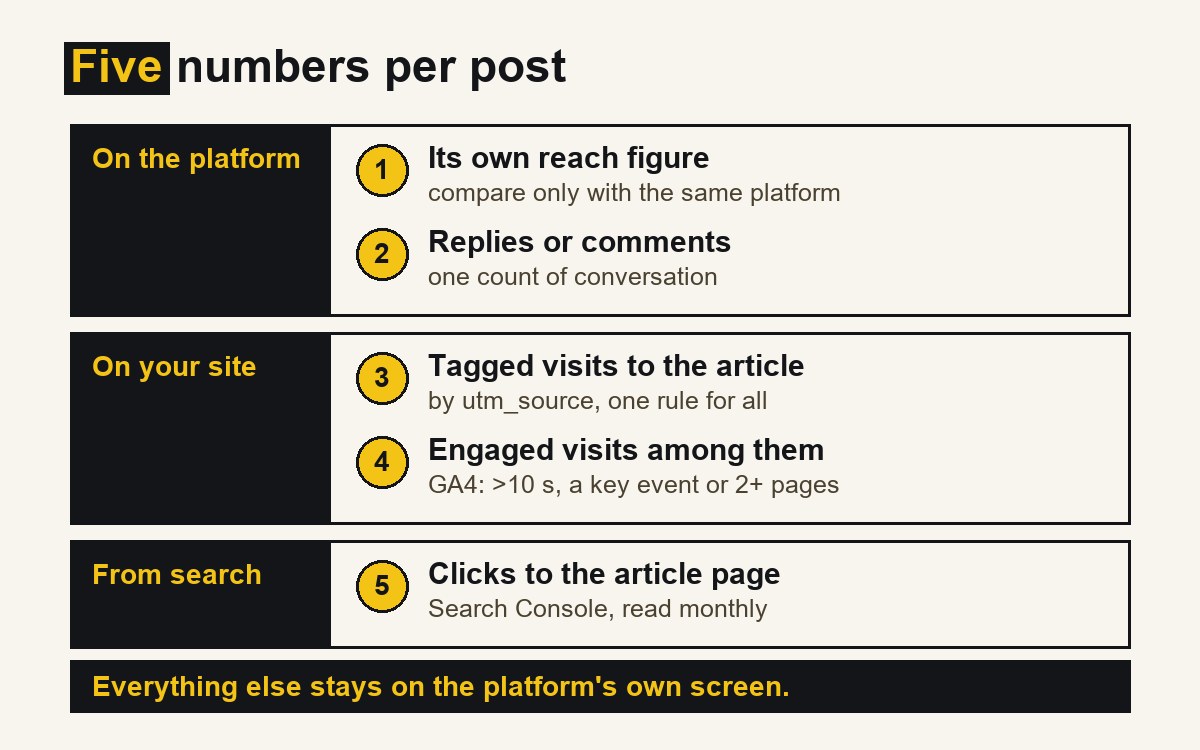
1. The platform's own reach figure. On X this is impressions, which X's developer documentation defines as the "Count of times the post appeared on a user's screen", not unique [1]. On LinkedIn there are two: impressions, which LinkedIn calls "an estimate", and members reached, the "Number of distinct members and pages who viewed your post. Repeat views aren't counted" [2]. If a platform offers a count of people, that is the better column. On Telegram it is the view counter that "each post in a channel has", which includes views of forwarded copies and which Telegram calls approximate [3]. This number is kept for comparing a post with the author's earlier posts on the same platform, never with another platform.
2. Replies or comments. One count of conversation, not a sum of all reactions. A reply is something a reader wrote, which makes it the easiest signal to inspect: the author can open the replies and read them. Likes, reposts and bookmarks remain visible on the platform if they are needed.
3. Tagged visits to the article. This is the only number in the table that uses one definition for all channels, because the website counts it, not the platform. It depends on tagging the link in each post. Google Analytics' help page on campaign links says that "When you add parameters to a URL, you should always use utm_source, utm_medium, and utm_campaign" [5]. Dapp.Expert's author posts use the platform name as the source, social as the medium and the article's identifier as the campaign. Visits from an untagged link fall into whatever the analytics tool can infer, which is usually less precise.
4. Engaged visits. Google Analytics counts a session as engaged when it lasts "longer than 10 seconds", includes a key event, or has "2 or more screen or page views" [6]. That is a low bar, not a measure of reading, but it separates visits that ended at once from visits that did something. Other analytics tools use other definitions; whichever tool is used, the column should say which.
5. Search clicks to the article page. Search Console counts a click as "The number of times a user clicked your site from Google Search results" [7]. Filtered to the article's address, it answers the third question: whether the piece is found without a post. It changes slowly, so it is read monthly, not per post.
Five numbers per post and channel is the whole per-post record. Three platforms make fifteen cells for one article.
Why the numbers have to be copied out
Part 6 of this series described who can see which numbers and for how long. For a dashboard, one detail matters most: on LinkedIn, at least, a post's counters are lifetime totals, so a value read on a given day cannot be looked up again later.
LinkedIn says it directly. Post metrics in the recent posts table are "lifetime totals" that "don't change when you change the date range" [2]. In that table, a post's reach on day seven is visible only on day seven; a month later the same cell can show a larger number. The same page offers to "Export your analytics to an .XLSX file to analyze further or save it for your records" [2], so LinkedIn itself expects authors to keep their own records.
Search Console keeps a longer history but not an unlimited one. Google's guide to traffic drops tells site owners to select "Last 16 months" in the date filter, and adds: "If you'd like to extend the 16 months, you could use the Search Analytics API or bulk data exports" [9]. Exports from a report are "limited to 1,000 rows of data" [8], enough for one author's article pages.
A spreadsheet row written on a fixed day keeps the value as it was on that day, whatever the platform shows afterwards.
How often: two readings, on fixed days
A per-post reading once, at a fixed age, is enough. Seven days after posting is a reasonable choice for a weekly routine, but the number itself is a convention, not a platform rule. What matters is that it is the same for every post, so that this week's post is compared with last month's at the same age. Part 5 of this series explained why; here the point is practical.
The platforms' own notes point the same way. LinkedIn's content performance graph "will populate up to yesterday" [2], so a same-day reading is incomplete. Search Console says "The newest data can be preliminary, meaning it's still being collected and might change in the next few hours" [7].
The second reading is monthly and covers search: clicks to each article page for the month, from Search Console, plus the follower count on each platform. That takes one sitting.
In practice the routine is one short session a week, filling the rows for posts that turned seven days old, and one longer session a month. Checking a post's numbers the day it goes out is not forbidden. It simply does not go in the sheet.
Where to keep them
One spreadsheet, owned by the author, in a place the author already backs up. A shared online sheet or a local file both work. What matters is that it does not live inside any one platform.
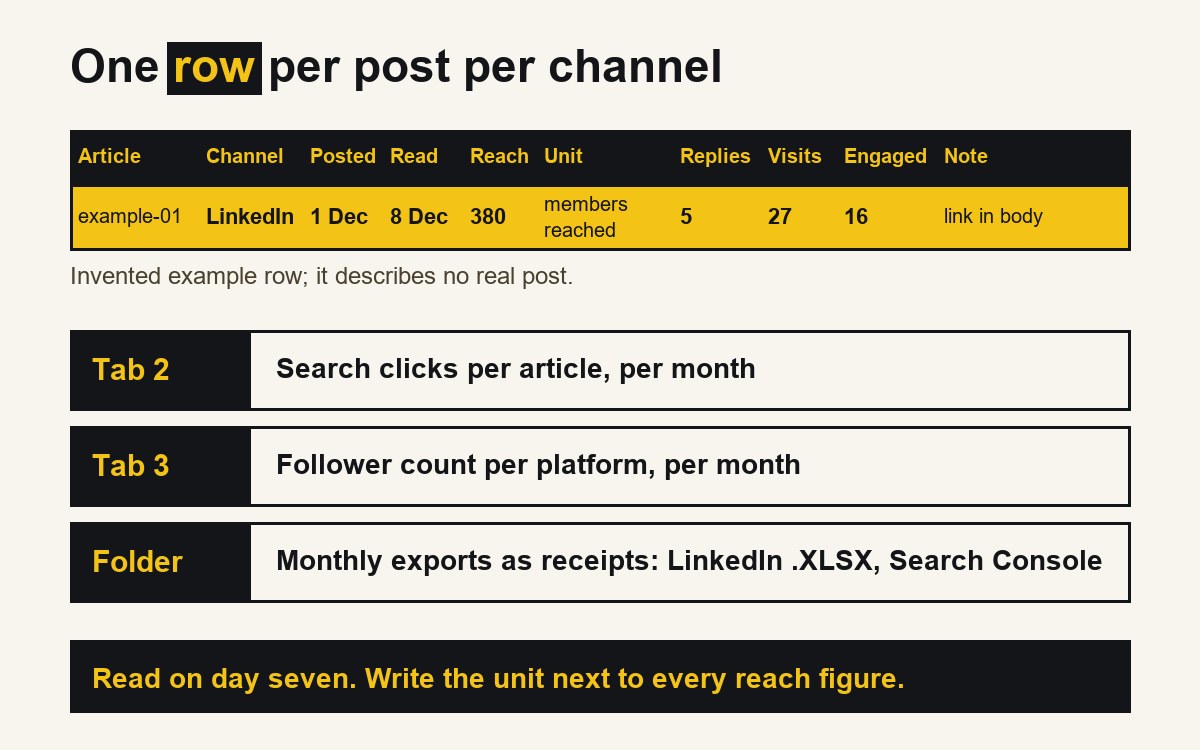
One row per post per channel. A workable set of columns:
- the article identifier (the same value used in utm_campaign);
- channel and post date;
- reading date (the post date plus seven days);
- reach figure, with its unit written in the next column ("impressions" or "members reached");
- replies or comments;
- tagged visits and engaged visits;
- a short note: format, whether the link was in the body, anything unusual.
Search clicks go on a second tab, one row per article per month. A third tab can hold the follower counts.
Next to the spreadsheet, a folder for raw exports: the LinkedIn .XLSX file [2] and a Search Console export of the article pages [8], saved once a month. The spreadsheet is the dashboard; the exports are the receipts if a number ever needs checking.
The row below is invented for this article and does not describe any real post.
| Article | Channel | Posted | Read | Reach | Unit | Replies | Visits | Engaged | Note |
|---|---|---|---|---|---|---|---|---|---|
| example-01 | 1 Dec | 8 Dec | 380 | members reached | 5 | 27 | 16 | link in body |
What to leave out
The shorter list is a choice, not an oversight. Several figures that platforms show prominently do not answer the three questions.
- Daily follower counts. A monthly reading answers the growth question; daily readings mostly record noise.
- Rates without their parts. An engagement rate is a ratio of two counts. If the two counts are in the sheet, the rate can be computed when needed; a rate copied on its own hides what was divided by what.
- Hour-by-hour graphs and demographics. Useful for an occasional question such as when to post, but they change rarely. They can be looked up on the platform when that question comes up.
- Sums across platforms. Part 5 covered why. The sheet should not have a "total reach" column.
Reading the sheet once a month
Once a month the sheet is read with the same three questions.
- Readers brought: for each channel, tagged visits per post, compared with the same channel's earlier posts. A channel that brings few visits over many posts is a candidate for less effort, or for a different kind of post.
- Readers who stayed: the share of engaged visits per channel. A channel with many visits and few engaged ones may be sending curious taps rather than readers.
- Found later: articles whose search clicks hold up or grow month after month. These are the pieces most worth updating and linking to from new posts.
Two cautions. A handful of posts is a small sample; one strong post can dominate a month. And platforms change their definitions, as part 5 described, so the unit column matters: a change in the unit is a reason to start a new comparison, not to continue the old one.
A short check before you set it up
- Does every column answer one of the three questions?
- Is every link in a post tagged with utm_source, utm_medium and utm_campaign?
- Is the reading day the same for every post?
- Is the unit written next to every reach figure?
- Are the monthly exports saved outside the platforms?
- Is there no column that adds platforms together?
What this article cannot tell you
X's help pages on its in-app analytics dashboard could not be opened for this article, so who can see that dashboard and what it exports are not described; the X definition quoted here comes from X's developer documentation. Telegram's own statistics screen is not covered: its tour says advanced statistics are available for channels with more than 500 subscribers [10], and its API documentation says the limit is a server-side setting [4], so a small channel may have only the per-post view counter. The seven-day reading is a convention chosen for a weekly routine, not a finding. The sample row is invented. Nothing here reports figures from Dapp.Expert's own accounts, and this article does not show that a smaller dashboard leads to better decisions; it describes a way to keep the numbers consistent enough to compare.
How this article was made
| Task | What the AI did | What a person did | How it was checked |
|---|---|---|---|
| Research | Collected platform documentation into research notes | Chose the question and the sources to rely on | Rules and quotes checked against the pages listed below [1]–[10] |
| Draft | Wrote the first draft from the notes | Edited the text, the column list and the routine | A separate review compared rules and claims with the sources |
| Images | Generated the cover photograph-style illustration | Chose the illustration; designed the explanatory diagrams | Labelled as AI-generated in the disclosure line and alt text |
| Not done by AI | — | The decision to publish and responsibility for the text | — |
Conflicts of interest: none. The author has no commercial relationship with X, LinkedIn, Telegram or Google.
Responsible for this article: Dmitriy Lastovka, author. Corrections: contact form.
Sources
All sources are official (the platform's own help, developer or documentation page), fetched on 16 November 2026.
- X Developer Platform, "Metrics" (public and non-public post metrics). https://docs.x.com/x-api/fundamentals/metrics Official.
- LinkedIn Help, "Combined post analytics". https://www.linkedin.com/help/linkedin/answer/a701208 Official.
- Telegram, "Channels FAQ". https://telegram.org/faq_channels Official.
- Telegram API, "Statistics". https://core.telegram.org/api/stats Official.
- Google Analytics Help, "URL builders: Collect campaign data with custom URLs". https://support.google.com/analytics/answer/10917952 Official.
- Google Analytics Help, "[GA4] Engagement rate and bounce rate". https://support.google.com/analytics/answer/12195621 Official.
- Search Console Help, "Performance report (Search results): Overview and basic setup". https://support.google.com/webmasters/answer/7576553 Official.
- Search Console Help, "Exporting data". https://support.google.com/webmasters/topic/12920294 Official.
- Google Search Central, "Debug Google Search traffic drops". https://developers.google.com/search/docs/monitor-debug/debugging-search-traffic-drops Official.
- Telegram, "Telegram Channels" (feature tour). https://telegram.org/tour/channels Official.