 and how can it be used in trading?")
The U.S. Dollar Index (USDX, DXY, DX, or unofficially known as "Dixie") is an indicator that measures the value of the U.S. dollar against a basket of foreign currencies, known as the currency basket of U.S. trading partners. When the U.S. dollar strengthens against other currencies, the index increases.
Contents:
- What is DXY?к
- Origin of the U.S. Dollar
- Index Using DXY Index for Cryptocurrency Market Analysis What is DXY?
What is DXY?
Numerous factors influence the strength of the dollar, including economic, political, military, climatic, and even speculative factors. An example of speculative influence could be the dot-com bubble crash in the early 2000s. Various factors have significantly influenced the behavior of the DXY index throughout its history, which can be studied on the English Wikipedia.
The DXY index perfectly reflects significant global economic changes, such as economic crises or periods of economic growth. An increase in the index indicates market instability, while a decrease indicates market strength.
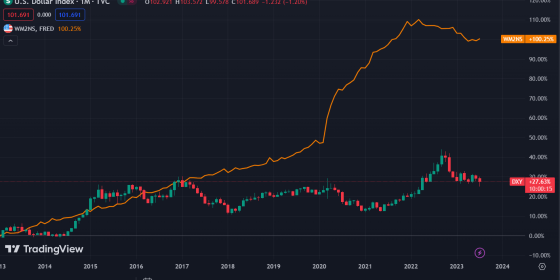
The above graph shows two charts: a candlestick chart of the DXY dollar index and a linear chart of the U.S. dollar money supply or dollar issuance volume. In March 2020, DXY reached its peak, accompanied by a market crash due to the onset of the COVID-19 pandemic. At this time, the U.S. Federal Reserve (Fed) began expanding the money supply by increasing dollar issuance over three months from $4.38 trillion to $16.3 trillion. This event was unprecedented. Subsequently, money flowed actively into the economy, leading to inflation rising from 2% to 9% and inflating speculative markets. The DXY index can be considered an indicator of global economic processes influencing speculative markets.
The currency basket against which DXY is calculated includes the following currencies, along with their percentage weights:
- Euro (EUR) - 57.6%;
- Japanese Yen (JPY) - 13.6%;
- British Pound (GBP) - 11.9%;
- Canadian Dollar (CAD) - 9.1%;
- Swedish Krona (SEK) - 4.2%;
- Swiss Franc (CHF) - 3.6%.
There is the dollar and there are the other currencies used by central banks of various countries, but it remains unclear how the index itself is formed and why the dollar is considered in contrast to the world's leading economies. That is, it is understood that, for example, the USD/EUR chart reflects the relationship between the dollar and the euro, but what specifically affects the strength or weakness of the currency? What factors influence this and how are they measured? Questions arise about the reasons for such a state. Let's try to figure it out.
Origin of the US dollar index
The U.S. Dollar Index emerged in early 1973 in response to the end of the Bretton Woods system, the era of the gold standard when the dollar was pegged to gold, and other central banks' currencies were pegged to the dollar at a fixed rate. This system provided balance in the economy and trade relations, where gold and the fixed dollar rate served as a benchmark.
The Bretton Woods system required countries to guarantee the convertibility of their currencies into U.S. dollars within 1% of the established parity. The dollar, in turn, could be converted into gold bars at a price of $35 per troy ounce of pure gold, which equated to 0.88867 grams of gold per dollar. However, over time, gold began to increase in value, and the purchasing power of the dollar decreased.
The Bretton Woods system also involved close cooperation between countries to prevent competitive devaluations of national currencies. As part of this cooperation, the International Monetary Fund (IMF) was created, which monitored exchange rates and provided reserve currencies to countries with a balance of payments deficit.
On August 15, 1971, the United States ceased the conversion of the dollar into gold, effectively ending the Bretton Woods system and turning the dollar into an unbacked fiat currency. This marked the end of the gold standard era, but the U.S. dollar continued to play the role of a global reserve currency.
When using the dollar index as an indicator for trading, traders may pay attention to the following points:
| Graph Analysis | Description |
|---|---|
| General Direction | Traders can analyze the overall trend of the U.S. Dollar Index to determine whether the dollar is in a strengthening or weakening phase. This can help them decide whether to take dollar positions or avoid them. |
| Inverse Correlation | The U.S. Dollar Index typically exhibits an inverse correlation with other currencies. Traders can use this knowledge to identify potential market trends and reversals. If the U.S. Dollar Index is rising, it may indicate weakness in other currencies and potentially create an opportunity for selling. |
| Support and Resistance Levels | Traders can analyze U.S. Dollar Index charts to identify key support and resistance levels. These levels can be helpful in making decisions about entering or exiting a position. |
| Confirmation of Other Signals | The U.S. Dollar Index can be used to confirm other technical or fundamental signals. For instance, if a trader sees a strong signal on the chart of a specific currency pair, they can check the U.S. Dollar Index to ensure it confirms that signal. |
Using the DXY Index for Cryptocurrency Market Analysis
Recently, there has been a correlation between the U.S. Dollar Index (DXY) and the stock market, and interestingly, since 2019, there has been some correlation between DXY and Bitcoin. This can be attributed to the increased liquidity and the emergence of various participants in the cryptocurrency market after 2017.
The inverse correlation between DXY and Bitcoin is particularly noticeable over long timeframes. When the dollar index starts to decline, the price of Bitcoin rises, and when the index strengthens, Bitcoin loses value.
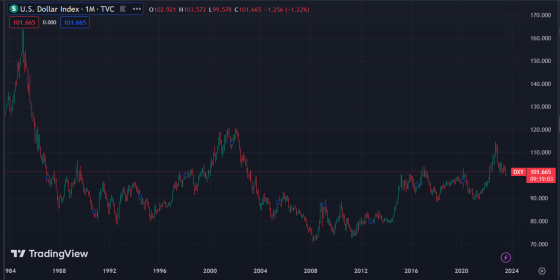
Let's examine the DXY index chart and analyze it:
- The DXY index chart for the entire history with a 1-month timeframe shows that the quote tends to reach a balance or the 100 mark. However, there are local trending movements in the index, with the latest one being represented as an ascending parallel channel.
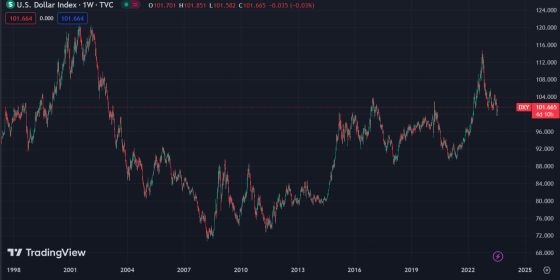
- The DXY index chart with a 1-week timeframe. Since 2008, an ascending parallel channel has formed, and the quote is still within this channel.
By analyzing data over such long timeframes, one can determine the overall trend. Taking into account events in major economies and recent developments in the cryptocurrency industry, conclusions can be drawn about the future movement of the index and how it may potentially impact the price of Bitcoin and the cryptocurrency market as a whole.
In conclusion, it should be noted that the DXY index cannot be the sole indicator for making investment decisions in the cryptocurrency market. However, it can be a useful additional factor for understanding medium and long-term market trends. Besides DXY, achieving long-term profitability also depends on various other factors and risk management skills.
