
In the cryptocurrency market, Bitcoin's dominance has influenced altcoin projects, including Polkadot. Polkadot saw an increase from $6.4 to a significant resistance level at $7.4.
Polkadot Chart Analysis
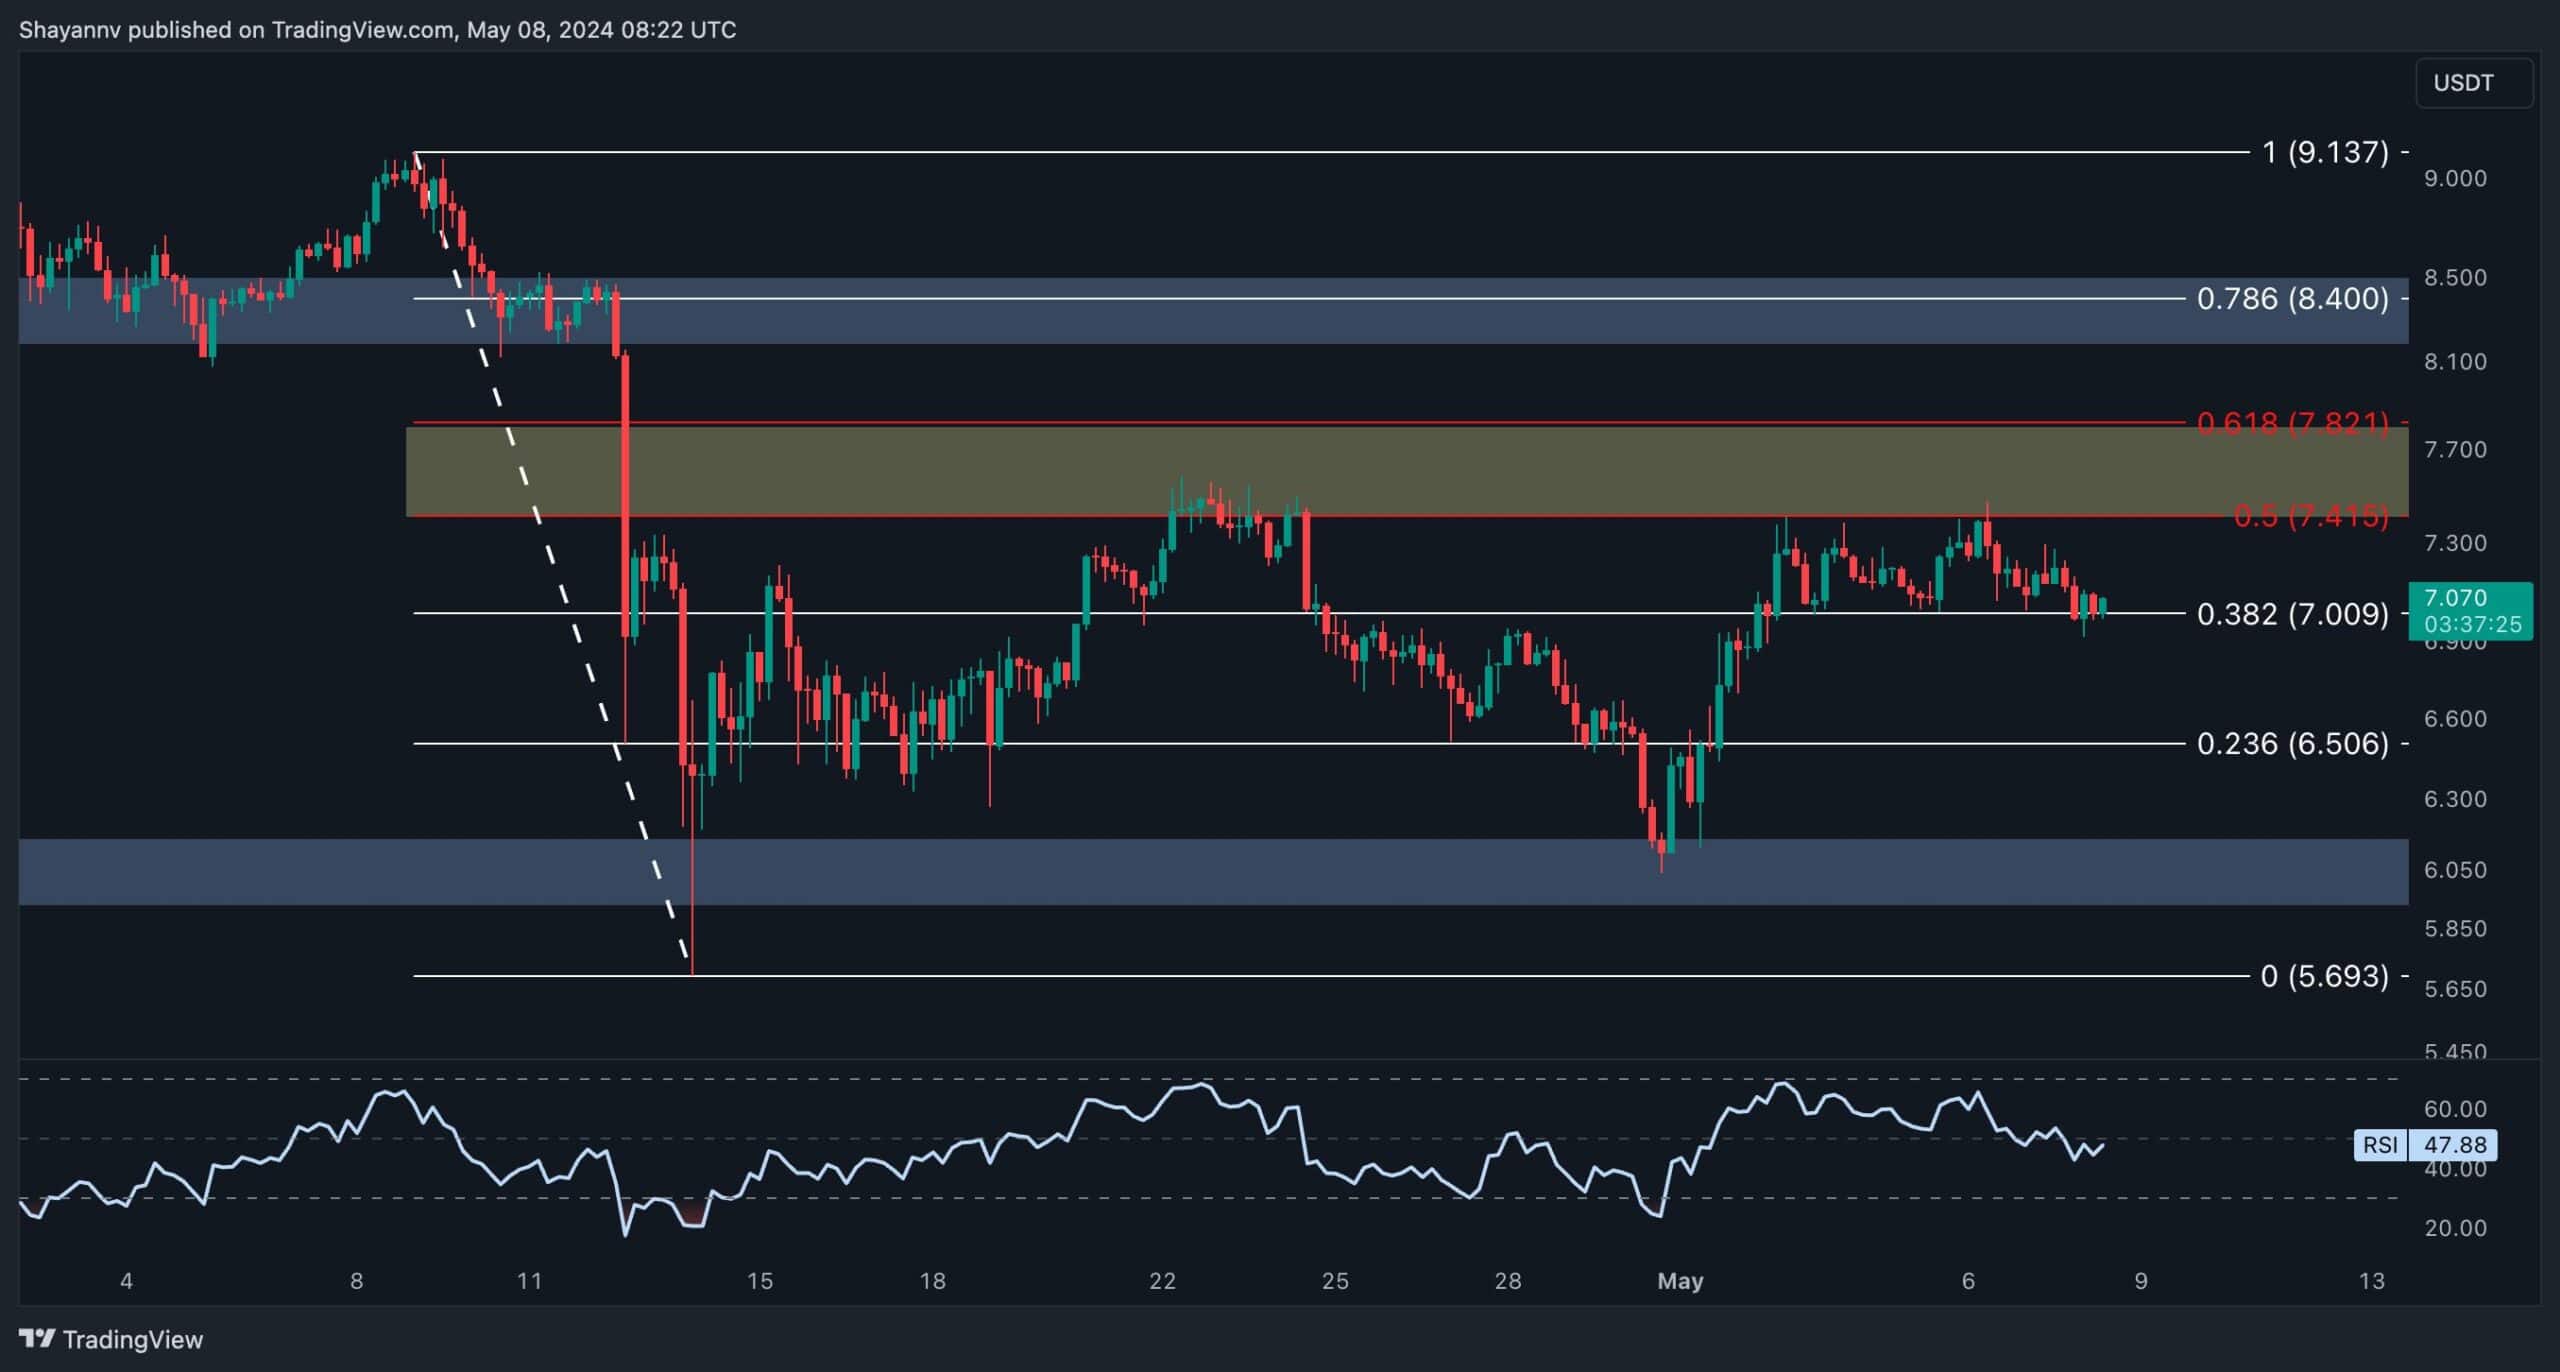
Upon close examination of the daily chart, Polkadot is moving sideways between $6.4 support and $7.4 resistance, causing uncertainty in the market's future direction. Recently, Polkadot rallied near the lower limit at $6.4 but faced resistance at $7.4, coinciding with the 200-day moving average.
This balance between buyers and sellers may lead to continued consolidation until a breakout occurs. A slight downward trend towards $6.4 support is anticipated in the short term.

Analyzing the 4-hour timeframe, Polkadot remains within the $6 - $7.4 range, with potential seller dominance suggesting another downward trend targeting the lower boundary.
Polkadot Data Analysis
Amidst price uncertainty, analyzing sentiment in the futures market is essential for predicting Polkadot's future. The chart shows a decline in Open Interest and Funding Rates, reminiscent of a pattern in early 2024. If demand increases and long positions are applied, a notable upward trend targeting higher prices may follow.

Source
The original post can be found at COINTURK NEWS: Recent Trends and Analysis in Polkadot’s Market Behavior


Comments