
Peter Brandt, a well-known figure in the financial markets, has once again caught the eye with his analysis of Ethereum's price chart, describing it as "very interesting". Brandt, renowned for his insightful analyses, shared his views on the recent fluctuations in Ethereum's price. This has led to discussions and speculation among traders and investors.
Analysis of Ethereum Price Trends
Brandt's assessment of the Ethereum chart brought attention amidst the uncertainties in the cryptocurrency market. Ethereum, being the second largest cryptocurrency, experienced a downward trend following Bitcoin's lead, resulting in price declines. Despite this, the current price of Ethereum stands at $3,002, showing a slight increase of 0.61%.

In his analysis, Brandt focused on two chart formations that could influence Ethereum's price movements. The initial formation resembled a flag, often seen as a continuation pattern during a pause in the trend. Brandt suggested that this could transform into a channel movement due to its length, although the direction remains uncertain.
Price Outlook and Market Analysis
A 24-hour price analysis for Ethereum revealed minor movements in basic technical indicators such as the Relative Strength Index (RSI) and Stochastic RSI. The RSI stood at 41.12, indicating a neutral stance without being overbought or oversold. This neutrality could lead to price uncertainties.
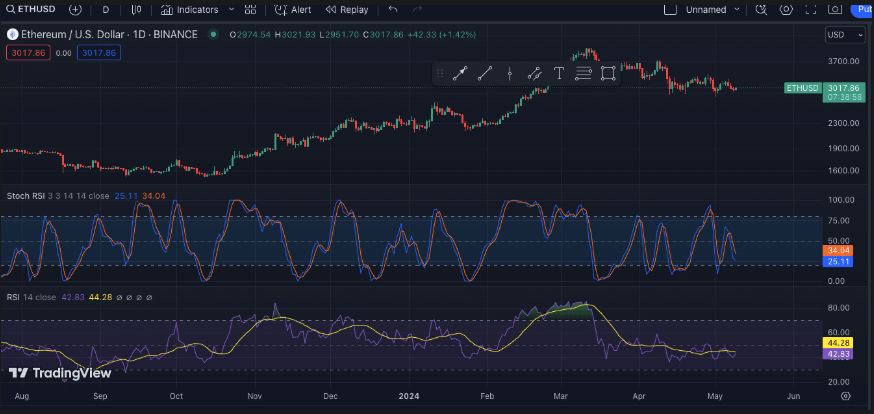
Furthermore, the Stochastic RSI, a sensitive indicator for trend reversals, was in the lower region. This suggests a potential short-term upward price movement after recent declines in Ethereum's price. Open interest (OI) in Ethereum increased by over 2% in the last 24 hours, reflecting growing interest and activity within the market.


Comments