
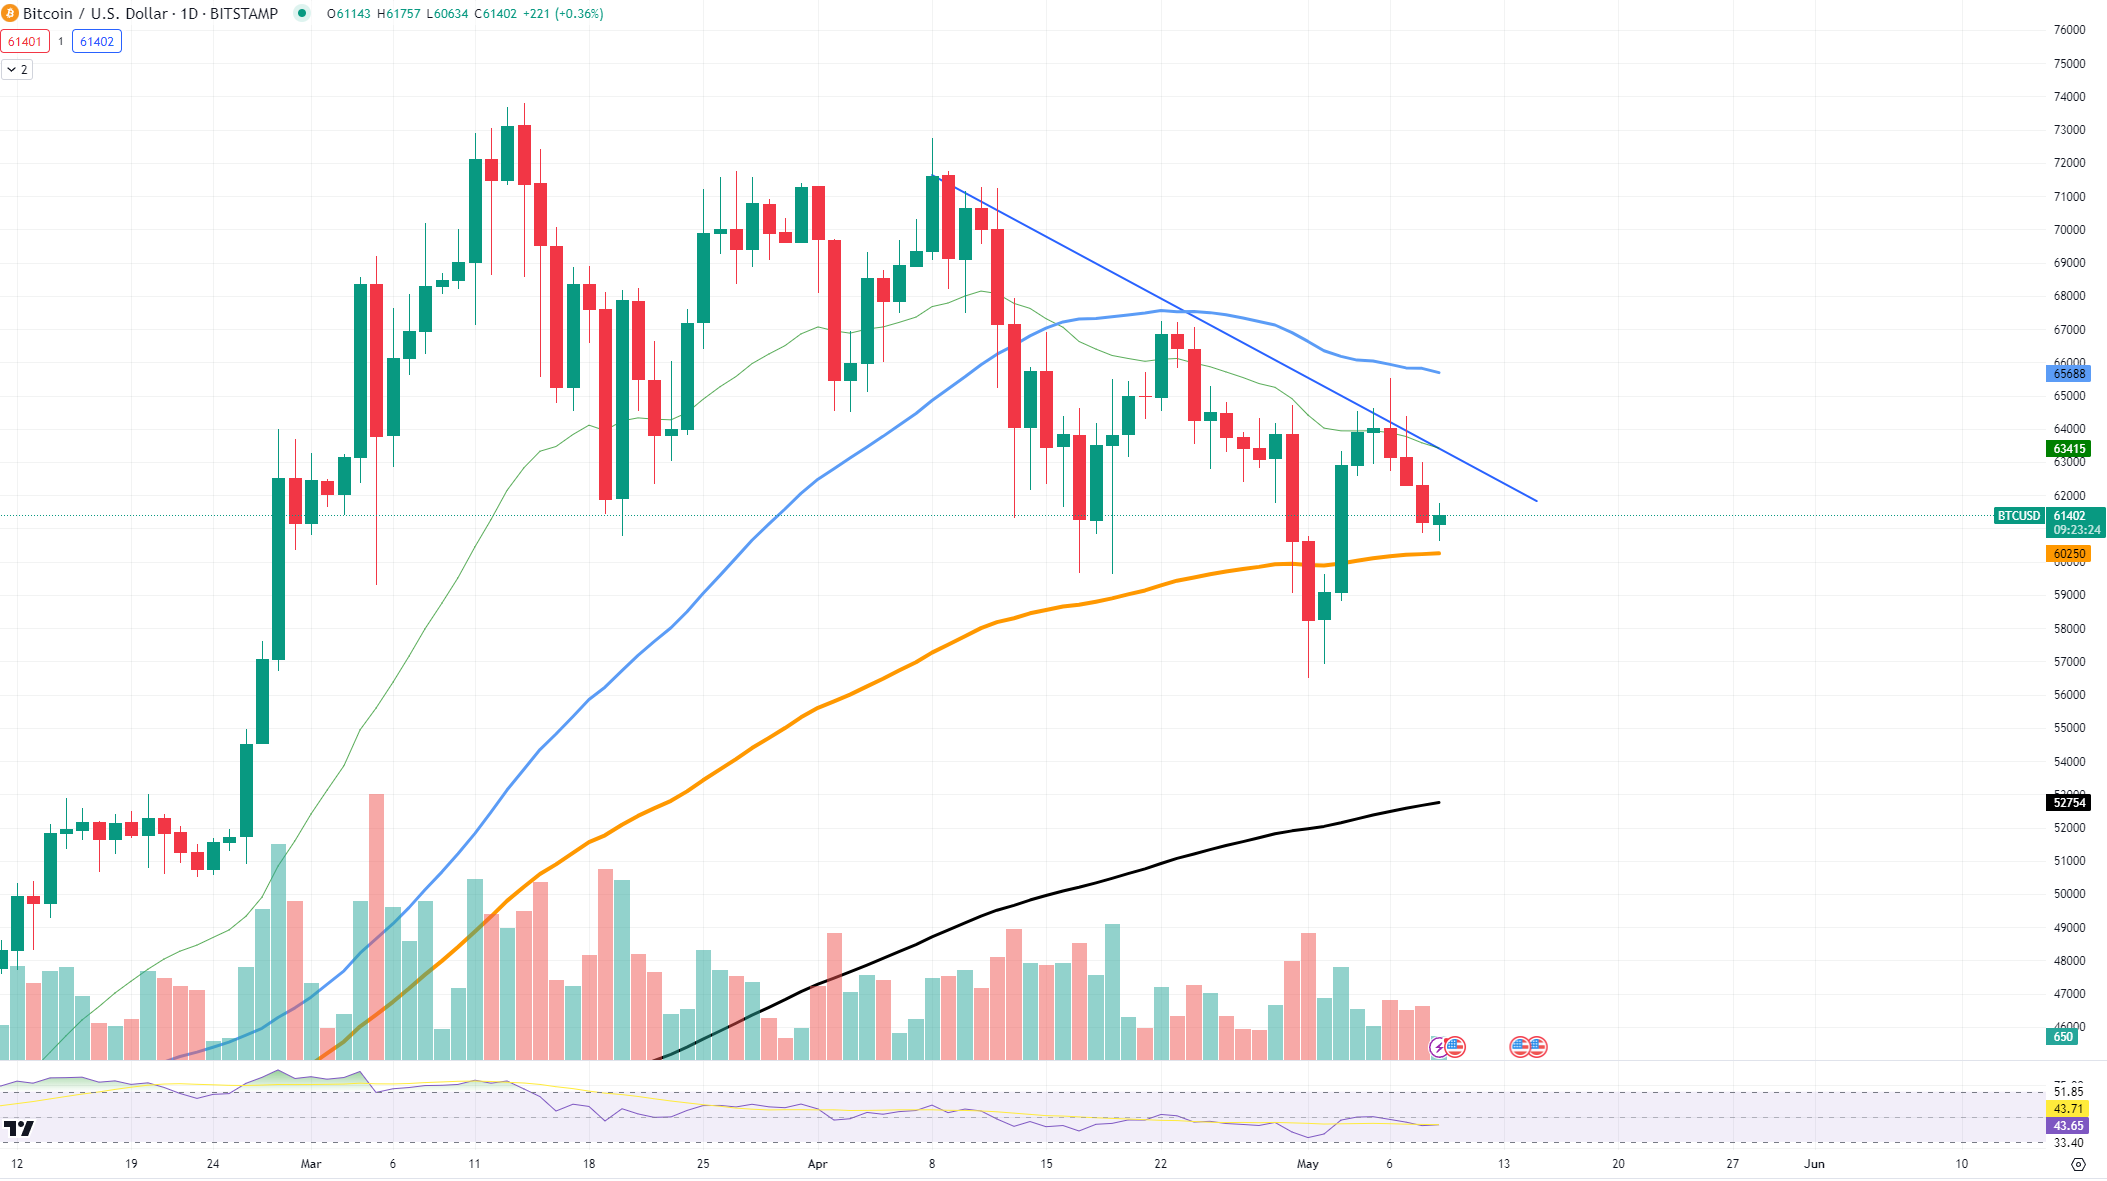
Bitcoin is currently in a critical position close to falling below the essential $60,000 level. A descending trendline is putting pressure on Bitcoin, leading to the formation of lower lows. This trend indicates that the downward movement could persist in the near future.
The downward pressure on Bitcoin has been visible, as every attempt to rise is met with resistance, causing lower highs. A decrease in trading volumes typically indicates a weakening trend and hints at a possible reversal. However, the signals currently suggest that the market is not yet shifting towards a bullish outlook.
Adding to the complexity is the higher low that is forming, indicating a potential shift in trend. This could signify that while the overall trend remains bearish, there is buying interest at lower levels, preventing further declines in Bitcoin's price.
The future direction of Bitcoin's price largely hinges on interactions with the trendline and crucial moving averages, including the 50-day Exponential Moving Average (EMA) sitting at approximately $65,000.
Shiba Inu at a critical level
Shiba Inu is at a crucial point as it maintains a strong support level around 0.00002260. The chart shows a descending triangle pattern, typically indicative of bearish pressure, suggesting SHIB might be facing significant selling pressure. While the 0.00002260 level is crucial, a break below could lead to testing the 0.00002100 support level.
On the upside, resistance lies near 0.00002400, and breaking this level could initiate a bullish turnaround, albeit facing challenges due to convergence of EMAs. Shiba Inu's current situation remains uncertain due to the combination of the descending triangle pattern, EMAs, and key support and resistance levels, signifying potential future volatility for SHIB.
Solana's possible reversal
Solana is demonstrating signs of a potential reversal pattern as it nears the 100-day EMA, suggesting a potential turnaround. However, uncertainties arise as this EMA has not been tested before, raising doubts about its reliability.
Currently, SOL is approaching a critical phase, with solid support at $128. Despite concerns about past breaches undermining its strength, reduced selling pressure signals a potential opportunity for buyers to drive the price upward. The lack of volume profile support for an inverse Head and Shoulders pattern casts some uncertainties on the immediate bullish prospects for Solana. Buyers may capitalize on minimized selling pressure in the mid-term for possible significant gains.


Comments