
Zaykchart is one of the most in-demand platforms for analyzing cryptocurrency markets. It provides powerful tools to help traders and investors navigate complex and ever-changing market conditions. From interactive charts to deep metric analysis, Zaykchart supports a wide range of cryptocurrency assets and facilitates decision-making processes.
Content:
- Key Features of Zaykchart
- Platform Usage for Cryptocurrency Analysis
- Analytical Tools of Zaykchart
- Conclusion

Key Features of Zaykchart
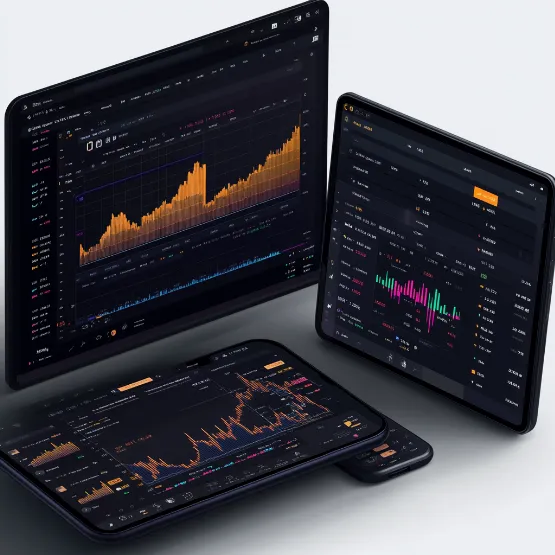
Zaykchart stands out due to its versatility and functionality. Users can track a wide variety of parameters and metrics, making it an ideal tool for analyzing cryptocurrency markets. The platform’s key features include support for a large number of cryptocurrency assets, interactive charts with customizable time frames, historical volatility tracking, correlation analysis of tokens, and providing metrics for market capitalization, trading volumes, and liquidity.
Platform Usage for Cryptocurrency Analysis
Zaykchart is actively used by traders, analysts, and investors to conduct deep analysis of cryptocurrency markets. The platform’s functionality allows users to:
- Track short-term fluctuations and use the data for short-term trading.
- Analyze long-term trends to develop long-term investment strategies.
- Compare metrics of different assets to identify correlations and market patterns.
- Assess asset liquidity to choose the most profitable entry points into the market.
These capabilities make the platform especially valuable for those looking for tools to make more informed decisions based on objective data.
Analytical Tools of Zaykchart
Zaykchart provides a variety of tools that help users obtain comprehensive market insights. One key aspect of the platform is access to metrics and analytical data. These data can be presented in tables and charts for more convenient analysis.
Table of key metrics for cryptocurrency analysis on Zaykchart:
| Metric | Description |
|---|---|
| Price | Reflects the current price of the cryptocurrency |
| Trading Volume | Shows the amount of assets sold over a specified period |
| Market Capitalization | The total value of all tokens issued for a given cryptocurrency |
| Volatility | Assesses the fluctuation in asset prices over time |
| Liquidity | The ability to quickly sell or buy an asset without a significant price change |
These data allow users to analyze assets more deeply, identify current trends, and find potential market entry points.
Conclusion
Zaykchart is a powerful tool for analyzing cryptocurrency markets. The platform offers interactive charts, metrics, correlation analysis, and other features that provide traders and investors with deep market insights. The platform’s capabilities make it an ideal choice for those who want to work with objective data and make decisions based on a full picture of the market.


Comments