
AI tools helped gather research and write the first draft of this article. I edited it and checked every figure and quote against the source page listed at the end. The cover illustration is AI-generated. Details at the end.
A term you care about suddenly climbs on Google Trends. A topic appears in a trending list. A new open-source project gains thousands of stars in a week. It is tempting to read any of these as the start of something and to write about it first.
Sometimes that is right. Often the line falls back as fast as it rose, and the article arrives after the interest has gone. The difference between a trend and a spike is not visible in a single chart on a single day. It shows up in what the number actually measures, in whether it lasts, and in whether other, independent signals move with it.
This is the first part of a new series, Interest Radar, on how to find questions worth researching before everyone else is answering them. It starts with the most basic problem: telling a lasting rise in interest from a short burst of noise.
What a trend tool actually counts
Most people read a Google Trends chart as a count of searches. It is not one, and the difference matters for early signals.
According to Google's own help page, Trends is built from "a largely unfiltered sample of actual search requests made to Google" [1]. Each data point is divided by the total searches in the same place and time range, then rescaled from 0 to 100 according to the topic's share of all searches [1]. So the chart shows a share of attention, not a number of people, and the scale is recalculated for every comparison you make.
Three details from the same page are especially important when a topic is new:
- Low volume shows as zero. Trends only shows data for terms that are popular enough; low-volume searches appear as 0, and Google notes that a zero does not mean nobody searched [1]. A narrow technical term can be genuinely growing and still read as a flat line.
- Noise is added on purpose. To protect privacy, Google adds statistical noise, which is most visible for low-interest queries. The help page warns that an apparent one-off spike can be a random fluctuation, and suggests comparing against common terms to judge scale [1].
- The clock changes with the window. For periods of 30 days or longer, the Explore graphs use UTC; for seven days or less, they use your browser's local time zone [1]. Hourly "spikes" in a short window and daily points in a long one are not directly comparable.
The "Related queries" panel has its own trap. "Rising" queries are ranked by their increase over the previous period, and "Breakout" replaces the percentage when a term grew by more than 5000% [2]. A breakout says the term grew fast from where it started. It does not say the starting point was large. A query going from almost nothing to a little is a breakout, too.
None of this makes the tool useless. It makes it a tool for comparing shares over time, not a meter that reads out demand.
What search data can and cannot predict
The best-known positive result is modest when you read it closely. In a 2009 Google working paper, later published in the Economic Record, Hyunyoung Choi and Hal Varian tested whether Trends data improved simple models of official statistics such as retail, car and home sales and visitor arrivals [3]. They were explicit about the limit: "We are not claiming that Google Trends data help predict the future" [3]. The claim was that search data can help estimate the present, before the official figure is published. In their car-sales example, the model with the search index had a mean absolute error about 3% smaller than the model without it; in other examples in the paper the gain was larger, roughly 12–18% [3]. Useful, but not a crystal ball.
The best-known failure shows what happens when a search signal is treated as more than that. Google Flu Trends was built to estimate doctor visits for influenza-like illness ahead of the US Centers for Disease Control and Prevention (CDC) reports. In a 2014 paper in Science, David Lazer and colleagues noted that in February 2013 it was predicting more than double the CDC's figure, and found that it had missed high for 100 out of 108 weeks starting in August 2011 [4]. The original method, they wrote, looked for the best matches among 50 million search terms to fit 1,152 data points [4]. With that many candidates, some terms will match the flu season by coincidence. They called the underlying mistake "big data hubris": treating big data as a substitute for, rather than a supplement to, traditional data collection [4].
Two lessons carry over to anyone watching topics:
- A search signal is strongest as a description of current attention. Reading it as a forecast is a separate claim that needs its own evidence.
- If you scan many terms for something that is rising, some will be rising by chance. The more you scan, the more important an independent check becomes.
In the research behind this series, no independent study was found that measures how far ahead of wider interest any public signal moves, whether search, developer activity or social trends. Lead-time figures quoted by vendors and practitioners were not independently tested. So this article does not offer a magic early indicator. It offers ways to avoid being fooled by a spike.
Why many spikes are noise, or bought
A spike is not always natural. Several studies show that the visible markers of "this is taking off" can be produced on purpose.
Trending lists. Tuğrulcan Elmas and colleagues described what they called ephemeral astroturfing on Twitter: coordinated activity from fake and compromised accounts pushes a chosen keyword into the trends list, and the activity is then removed as part of the attack [5]. In their paper, accepted at IEEE Euro S&P 2021, trends astroturfed this way accounted for at least 20% of the top 10 global trends [5]. That was Twitter several years ago, and the share may be different on today's X. The point is that a trending label alone is weak evidence.
Developer popularity. Hao He and colleagues built a tool to detect suspicious starring behaviour across GitHub metadata from 2019 to 2024. Their preprint, titled "Six Million (Suspected) Fake Stars in GitHub", reports that fake-star activity surged in 2024 and that fake stars "only have a promotion effect in the short term (i.e., less than two months)" and become a liability in the long term [6]. A bought spike, in other words, can look exactly like a real one for several weeks and then stop. The next articles in this series look at developer signals in more detail.
Changes in how the data are made. Sometimes a line moves because the rules changed. From 1 October 2026 arXiv limits each submitter to two submissions per calendar month, as a stopgap after record volume: 40,363 submissions in September 2026, compared with 20,569 in September 2024 [7]. Anyone counting new papers on a topic will see a drop in October that says nothing about interest in the topic. Comparing a topic's share of all papers, rather than raw counts, reduces this problem, and the date of the break should be written down.
Short-lived formats. On social video, quick decay is the normal pattern. A Publicis Groupe APAC study across seven markets, reported by Marketing-Interactive, found that nearly half of TikTok trends disappear within five days and only a small minority remain relevant beyond two weeks [8]. It is an agency study, praised by TikTok in the same article, with no disclosed sample, so treat the numbers as indicative. They still suggest that a week is a short time in a social feed and a long time for a trending sound.
Trend or spike: what each looks like
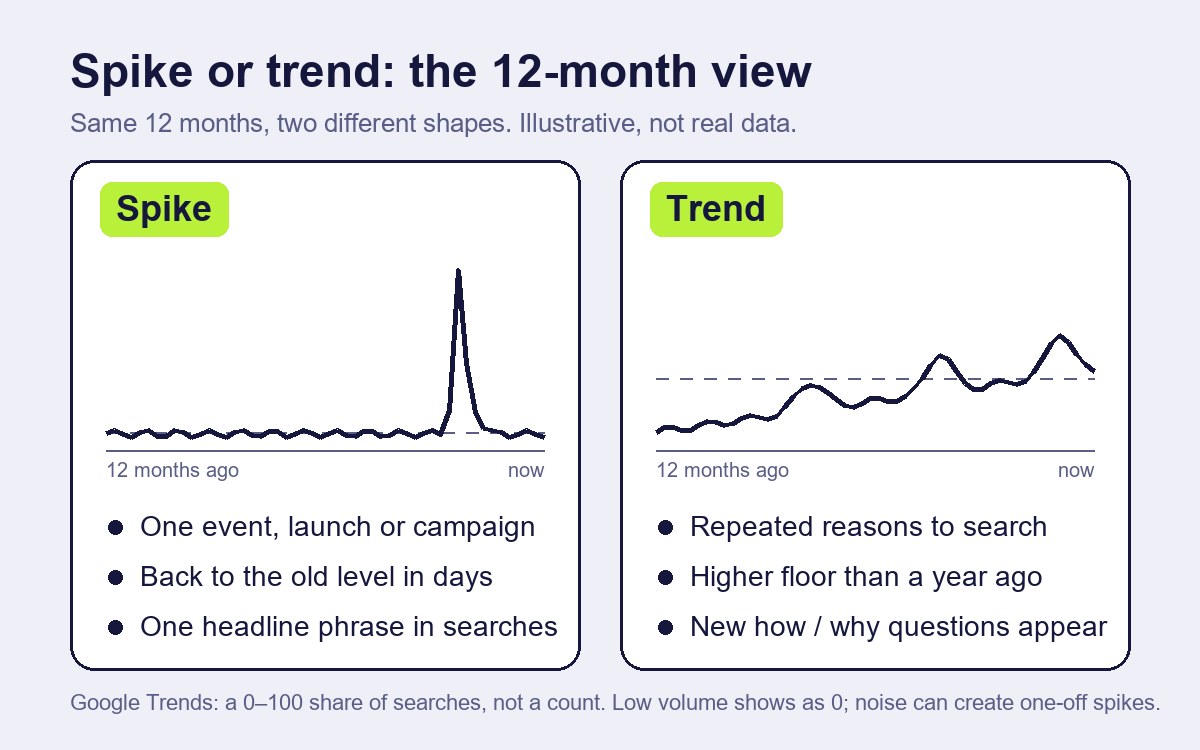
Putting the evidence together, a few practical differences stand out. None is proof on its own; they are reasons to look closer.
| Spike | Trend | |
|---|---|---|
| Shape over 12 months | One sharp peak, back to the old level | A higher floor than a year ago, even after peaks |
| Cause | One event, launch, campaign or data change | Repeated reasons to search, build or discuss |
| Related queries | One headline phrase | A widening set of practical questions (how, why, compared with) |
| Other signal types | Only attention moves | Builders, attention and demand move, not necessarily together |
| Can it be bought? | Often from cheap, easy-to-game sources | Harder to fake across independent sources |
The third row is the one writers can use most. A spike produces many searches for the same name. A trend produces new questions: how to set it up, why it fails, what it is compared with. Those questions are what an article can answer.
Five checks before you write about a rising topic
These checks come from the research notes behind this series. They are a working method, not a tested model, and the first weeks of using them are best treated as calibration.
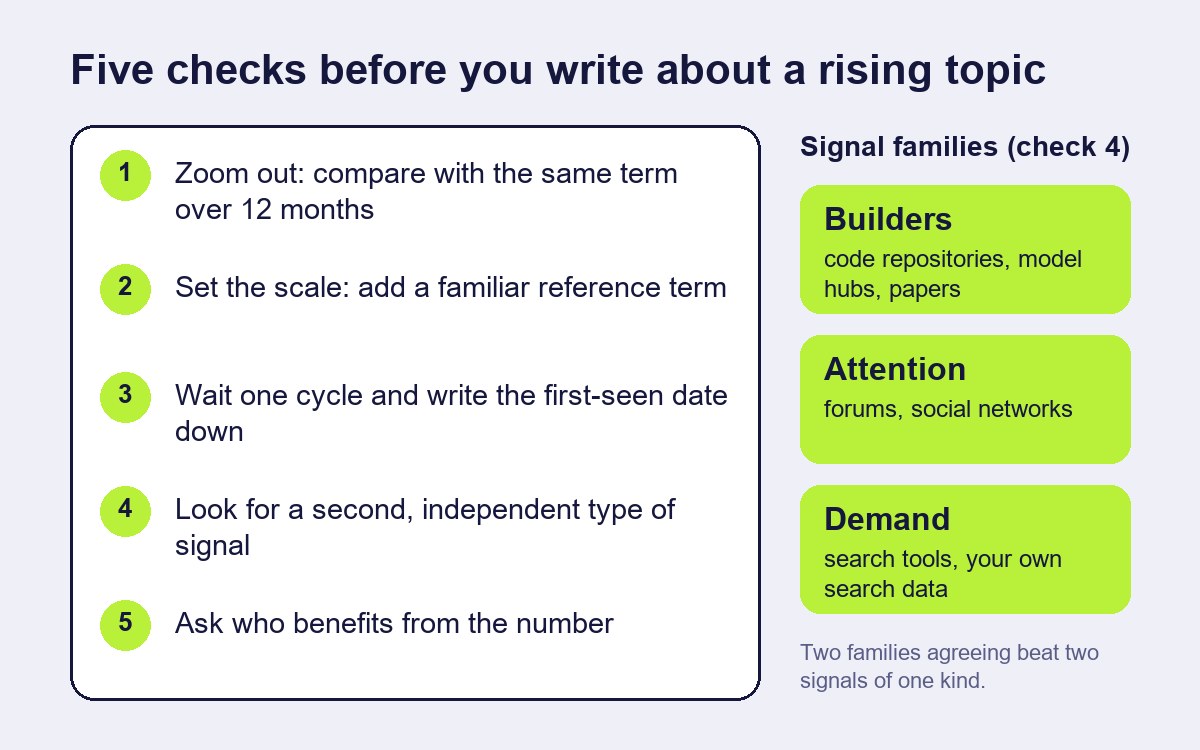
- Zoom out. Look at the same term over 12 months, not only the last seven days. If the recent peak only returns the line to where it was last year, it is not new. For terms with several meanings, check both the topic and the plain search term.
- Set the scale. Add a familiar comparison term, as Google itself suggests [1]. A rise that disappears next to a modest reference term is small, whatever the percentage says. Treat a breakout label as "fast growth from an unknown base".
- Wait one cycle and write the date down. Record the date you first saw the signal and look again a week later. A spike usually shows itself within days. Keeping a simple log (topic, signal, first-seen date, what you could add, decision, result after four weeks) also builds the only lead-time evidence you are likely to get: your own.
- Look for a second, independent type of signal. The research notes group signals into three families: builders (code repositories, model hubs, papers), attention (discussion forums, social networks) and demand (search tools, your own search data). Two signals from the same family can share the same cause. Two from different families are better evidence. A proposed rule: write when at least two types agree and you have something to add; watch when there is one signal or no angle; skip when the only evidence comes from easily bought sources.
- Ask who benefits from the number. Star counts and trending positions can be inflated [5][6]. If a rise would directly benefit the people behind the project or token, give it less weight until something harder to fake confirms it.
A worked example (fictional)
The topic and the figures in this section are invented to show the method.
Suppose a term for a new wallet feature appears as "Breakout" in the related queries for a common wallet term on a Monday. Over seven days the chart rises from almost zero to 100.
Zooming out to 12 months shows nothing before last week: the term is genuinely new, so check 1 does not settle it. Adding a common wallet term as a reference turns the new line into a thin ripple: the attention is real but small. A week later the line has fallen to a third of its peak. That alone would suggest a spike around one announcement.
But the related queries have changed. Instead of the product name, people now search "how to enable" and "is it safe". A small open-source library implementing the feature has a few dozen new forks and open issues, not just stars. Two families, demand and builders, now point the same way, and the questions are specific enough to answer.
The decision is to watch for one more week and prepare a short explainer, rather than publish a "the next big thing" piece on Monday. If the questions keep coming, the explainer is ready. If they stop, nothing was lost.
What this article cannot tell you
It cannot tell you how early any signal is. No independent study measuring lead time was found for any of the sources discussed, and the five checks have not been tested experimentally. The Flu Trends and Choi–Varian findings come from search data about health and the economy, not from technology or Web3 topics. The astroturfing study describes Twitter trends before the platform became X, and the TikTok figures come from a vendor report. The worked example is invented.
How this article was made
| Task | What the AI did | What a person did | How it was checked |
|---|---|---|---|
| Research | Collected sources on trend tools, search data and manipulated signals into research notes | Chose the question and the sources to rely on | Figures and quotes checked against Google's help pages, the papers or their official abstracts, the arXiv blog and the published report [1]–[8] |
| Draft | Wrote the first draft from the notes | Edited the text, the checks and the worked example | A separate review compared figures and claims with the sources |
| Images | Generated the cover photograph-style illustration | Chose the illustration; designed the explanatory diagrams | Labelled as AI-generated in the disclosure line and alt text |
| Not done by AI | — | The decision to publish and responsibility for the text | — |
Conflicts of interest: none. The author has no commercial relationship with the companies, researchers or organisations named; the topic in the example is fictional.
Responsible for this article: Dmitriy Lastovka, author. Corrections: contact form.
Sources
Labels: official (the organisation's own page), paper (peer-reviewed or preprint study, read in full or via its official abstract), working paper, report (vendor study as published in the trade press).
- Google Trends Help, "FAQ about Google Trends data". https://support.google.com/trends/answer/4365533 Official.
- Google Trends Help, "Related topics and queries" (Top, Rising, Breakout). https://support.google.com/trends/answer/4355000 Official.
- Hyunyoung Choi, Hal Varian, "Predicting the Present with Google Trends", Google working paper (draft of 10 April 2009); later published in Economic Record 88 (2012). https://static.googleusercontent.com/media/www.google.com/en//googleblogs/pdfs/google_predicting_the_present.pdf Working paper, read in full. Journal version: https://doi.org/10.1111/j.1475-4932.2012.00809.x
- David Lazer, Ryan Kennedy, Gary King, Alessandro Vespignani, "The Parable of Google Flu: Traps in Big Data Analysis", Science 343 (14 March 2014), 1203–1205. https://doi.org/10.1126/science.1248506 ; author copy: https://gking.harvard.edu/files/gking/files/0314policyforumff.pdf Paper, read in full.
- Tuğrulcan Elmas, Rebekah Overdorf, Ahmed Furkan Özkalay, Karl Aberer, "Ephemeral Astroturfing Attacks: The Case of Fake Twitter Trends", IEEE Euro S&P 2021. https://arxiv.org/abs/1910.07783 Paper, official abstract.
- Hao He, Haoqin Yang, Philipp Burckhardt, Alexandros Kapravelos, Bogdan Vasilescu, Christian Kästner, "Six Million (Suspected) Fake Stars in GitHub: A Growing Spiral of Popularity Contests, Spams, and Malware", arXiv:2412.13459. https://arxiv.org/abs/2412.13459 Paper (preprint), official abstract.
- arXiv blog, "Fair Moderation, Equitable Access, and AI: arXiv's Updated Rate Limit Policy" (1 October 2026). https://blog.arxiv.org/2026/10/01/updated-rate-limit-policy/ Official.
- Marketing-Interactive, "Only a fraction of TikTok trends last beyond two weeks, Publicis Groupe finds" (Publicis Groupe APAC study). https://www.marketing-interactive.com/only-a-fraction-of-tiktok-trends-last-beyond-two-weeks-publicis-groupe-finds Report.