

AI tools helped gather research and write the first draft of this article. I edited it and checked every figure and quote against the source page listed at the end. The cover illustration is AI-generated. Details at the end.
You spend an afternoon collecting what players of one game ask: forum threads, replies under videos, questions in community chats. At the end you have a spreadsheet with a hundred rows. A hundred is a satisfying number, and it is tempting to write in the planning document, "players clearly want to know this."
The spreadsheet does support a claim. It just is not that one. A list of found questions is a record of what you were able to find, not a measurement of how many people want an answer. The two get confused because the rows look like demand: each one is a real person asking a real question.
This is Part 7 of Interest Radar, a series on finding questions worth researching. Earlier parts covered trends against spikes, combining public trends with your own search data, misleading developer signals, and who is missing from audience research (Part 4). Here the focus is narrower: what a hundred found questions can and cannot tell you, with player questions about games as the working example.
Three things a hundred rows are not
They are not a count of people. One person can ask the same thing in three places, and ten people can ask it in ten different phrasings. Before counting rows you decide which rows are "the same question". That decision moves the total more than any real change in the audience.
They are not a count of searches. A question asked on a forum is a post. A search is a query typed into a search engine. A person who posts a question may have searched first and found nothing, which is itself informative, but it means the forum question and the search volume are two different events with an unknown ratio between them.
They are not a random sample. You found these rows with particular tools, phrases and places. Someone else, with other phrases or other places, would hold a different hundred. This is the main issue, and the next section takes it apart.
Where the hundred came from
Every collection route has a shape. Three common ones, with documented limits:
- A social platform's search. X's recent search covers "the last 7 days"; reaching further back belongs to the full-archive search, which is "available to pay-per-use and Enterprise customers" [5]. A hundred questions from recent search is a hundred from one week, and a week can hold a game update, a streamer's video or a patch that makes one question unusually common.
- Your own keywords. You can only find questions that contain the words you thought to type. Players describe a problem in their own terms, which are often not yours.
- One community. Ruths and Pfeffer, in a Science policy forum on studying behaviour through social media, describe the common assumption "that a large-enough sample of users will drown out noise introduced by peculiarities of the platform's population", and answer that "substantial population biases vary across different social media platforms" [4]. They wrote about research on whole populations, not editorial planning, but the logic carries over: more rows from one place do not remove that place's bias; they only make it look better supported.
Who the collection leaves out, the players who never post or search in your language, is the subject of Part 4; the point here is only that no row in the spreadsheet tells you how many they are.
Why search volume looks different from a list of questions
Even if you could count searches perfectly, a list of questions would not match them, because search behaviour is long-tailed. Google said in 2019 that "15 percent of those queries are ones we haven't seen before" among all the queries it sees each day [3]. Ahrefs reports that keywords with fewer than 10 searches a month "account for almost 93%" of its U.S. keyword database [6]. This is a vendor's own database and its method is not public, so treat it as an indication of shape rather than a precise figure. The shape is clear anyway: a few phrasings are searched often and a very large number are searched rarely.
Two consequences follow for anyone collecting questions.
First, the questions you find are biased toward the visible ones. A question that lives on a forum page, or in a search suggestion, is a question that someone indexed. The rare phrasing that thousands of people type once each leaves no row.
Second, the public tools cannot see the bottom of the tail. Google Trends is explicit: "only a sample of Google searches are used", the numbers are "scaled on a range of 0 to 100", and "Trends only shows data for popular terms, so search terms with low volume appear as '0'" [1]. Search Console omits what it calls anonymized queries, those "that aren't issued by more than a few dozen users over a two-to-three month period", from its tables, "to protect the privacy of the user making the query" [2]. Google Ads marks keywords with "very little to no search history" as low search volume and keeps them out of the auction [7]. In each case a question that would matter if a thousand different people typed it once is invisible, or rounded to zero, in the tool you would use to check it.
So a hundred specific questions can describe a long tail that no tool will confirm. That does not make them worthless. It makes them evidence of a different kind.
What a hundred questions can honestly show
A list of found questions is good at four things:
- Vocabulary. The words players actually use, which are often not the words in a guide or a keyword list.
- Types of need. After grouping, you can see whether people mostly ask "how do I do this", "is this worth buying", "why did this break" or "what changed". That mix tells you what shape of article answers them.
- Gaps. Questions where the replies are wrong, contradictory or missing show where an accurate page would be new.
- Candidate topics. Each group is a hypothesis: "people want to know this". Hypotheses are what the list is for.
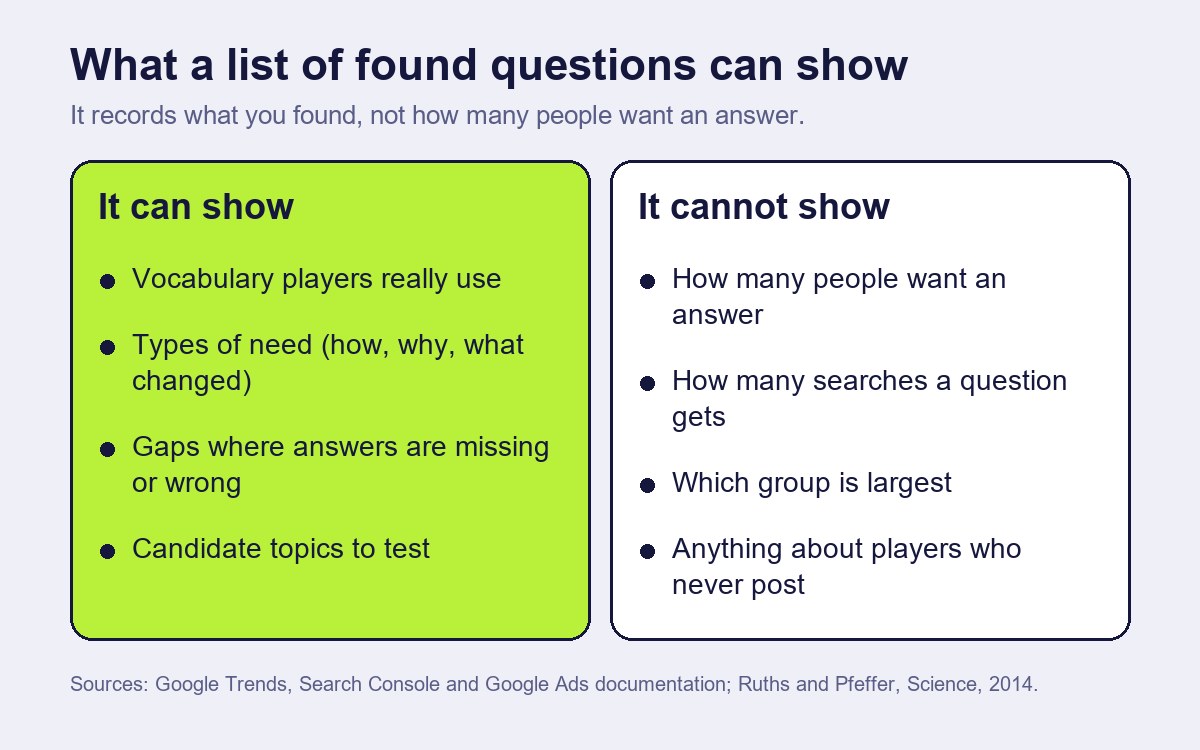
What it cannot do is rank those hypotheses by size. A group with twenty rows is not necessarily larger than a group with three. It may only mean that group is easier to find.
There is also a plain statistical limit. If a hundred rows were a genuine random sample of the audience, which they are not, a share measured from them would carry a margin of about ±10 percentage points at 95% confidence in the worst case (1.96 × √(0.5 × 0.5 / 100) ≈ 0.098; this is the standard formula for a proportion and my own arithmetic, not a figure from a source above). "Thirty percent of questions are about crafting" would then mean somewhere between roughly 20% and 40%. Since the rows are not random, the real uncertainty is larger and cannot be written down as a number.
From a list to an estimate: five rungs
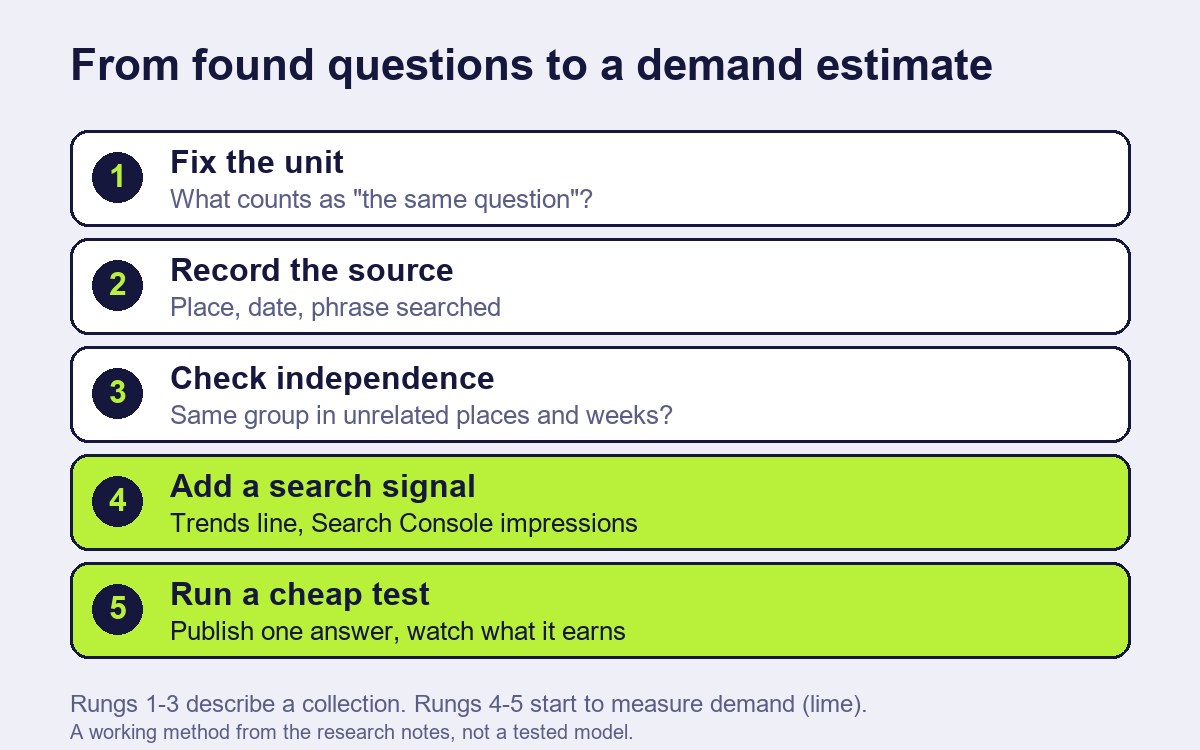
The steps below are a working method drawn from the research behind this series, not a tested model. Each rung adds a kind of evidence the list lacks. Stop climbing when you have enough for the decision you are making.
- Fix the unit. Write the rule for "same question" before you count. For example: same need, same game and version, any wording. Count groups, not rows, and keep the rule so a later collection can follow it.
- Record where each row came from. Place, date, phrase searched. A column with three or four values is enough. If most rows come from one source or one week, say so next to any number.
- Check independence. A group that appears in several unrelated places and several different weeks is stronger than a group with many rows from a single thread. Replies in one thread are not independent of each other.
- Add a signal that measures searching. Look at whether the topic exists as a search at all. Google Trends gives a relative line for terms popular enough to appear [1]. If you have a site, Search Console shows how often it appeared for related queries; its Help defines an impression as "how many times your site appeared in Search results" [8], which is not a count of people and not a count of searches by themselves. Part 2 of this series goes through lining these two up. Either one can come back empty for a narrow question, and an empty result is not proof of no demand [1][2].
- Run a cheap test. Publish a short, accurate answer to one group and watch what it earns over a few weeks: appearances in search, visits, whether the answer is linked back. This is the only rung that measures demand for your answer, not interest in the topic.
If you cannot get beyond rung 2, call the result what it is: a list of candidate topics from a limited collection, not a demand estimate.
A worked example (fictional)
The game, the questions and the figures in this section are invented to show the method.
An editor covers an imaginary farming game, Moss Valley. Over one afternoon they collect 100 questions. Sixty-two ask why crops in the greenhouse stop growing. Eleven are about trading. The rest are scattered. The note in the plan reads: "Greenhouse growth is the biggest demand."
They go up the ladder. Rung 1: the sixty-two rows turn out to be nine different needs once grouped; a version-specific bug accounts for most. Rung 2: fifty-four of the sixty-two come from two forum threads opened the week after a patch. Rung 3: outside those two threads, greenhouse questions appear in four places in the whole month, at a normal rate for the game. Rung 4: a related term appears on Trends only as a short spike in the patch week, and the editor's site has too little search history to say anything. Rung 5: the editor publishes a short answer on the patch bug and, separately, an article on trading, which had only eleven rows but came from six places over three months.
After a month the trading article earns steady search appearances; the patch-bug note earned a burst and then faded. The editor concludes that greenhouse growth was a real but temporary question, and that the eleven trading rows described the lasting one. The count of rows had pointed the wrong way.
What this article cannot tell you
It cannot tell you how many searches a particular game question gets, or give a number of rows that "is enough". No source found a rule for that, and the 93% figure comes from one vendor's database [6]. The margin-of-error figure is a textbook calculation for random samples and does not apply to the rows you collect. The Ruths and Pfeffer paper concerns research on social media data in 2014, and platform access rules have changed since; the point I take from it is the logic of bias, not any platform detail [4]. The five rungs have not been tested experimentally. The worked example is invented.
How this article was made
| Task | What the AI did | What a person did | How it was checked |
|---|---|---|---|
| Research | Collected sources on search data limits and sampling bias into research notes | Chose the question and the sources to rely on | Figures and quotes checked against the pages listed as [1]–[8] |
| Draft | Wrote the first draft from the notes | Edited the text, the five rungs and the worked example | A separate review compared figures and claims with the sources |
| Images | Generated the woodblock cover illustration (from the Dapp.Expert cover library) | Chose the illustration; chose the diagram content; the diagrams were built in code | Labelled as AI-generated in the disclosure line and alt text |
| Not done by AI | — | The decision to publish and responsibility for the text | — |
Conflicts of interest: none. The author has no commercial relationship with Google, Ahrefs, X or the researchers named; the game in the example is fictional.
Responsible for this article: Dmitriy Lastovka, author. Corrections: contact form.
Sources
Labels: official (the organisation's own page), vendor (a company's own published data), paper (published study).
- Google Trends Help, "FAQ about Google Trends data". https://support.google.com/trends/answer/4365533 Official.
- Daniel Waisberg, "A deep dive into Search Console performance data filtering and limits", Google Search Central Blog (19 October 2022). https://developers.google.com/search/blog/2022/10/performance-data-deep-dive Official.
- Pandu Nayak, "Understanding searches better than ever before", The Keyword, Google (25 October 2019). https://blog.google/products/search/search-language-understanding-bert/ Official.
- Derek Ruths, Jürgen Pfeffer, "Social media for large studies of behavior", Science 346 (6213), 1063–1064 (28 November 2014). https://doi.org/10.1126/science.346.6213.1063 Paper, full text read.
- X Developer Platform, "Search posts" (recent search and full-archive search). https://docs.x.com/x-api/posts/search/introduction Official.
- Ahrefs, "Long-tail keywords" (article updated 27 May 2026). https://ahrefs.com/blog/long-tail-keywords/ Vendor data; method not public.
- Google Ads Help, "Low search volume: Definition". https://support.google.com/google-ads/answer/2616014 Official.
- Search Console Help, "Performance report (Search results): Overview and basic setup". https://support.google.com/webmasters/answer/7576553 Official.