

AI tools helped gather research and write the first draft of this article. I edited it and checked every figure and quote against the source page listed at the end. The cover illustration is AI-generated. Details at the end.
When you look for questions worth writing about, you read what people say in public: posts, replies, forum threads, search suggestions, your own analytics. All of it comes from people who spoke, searched or clicked in a place you can see. Nobody who stayed quiet, used another platform, or searched so rarely that a tool hid it is in the data. Their absence does not look like a gap. It looks like a clean, confident chart.
This is not a reason to distrust public data. It is a reason to ask one more question of every source: who could have ended up in this data, and who could not? An honest answer changes what you can claim from it.
This is the fourth part of Interest Radar, a series on finding questions worth researching. Part 1 dealt with telling a lasting trend from a short spike, Part 2 with putting public search trends next to your own search data, and Part 3 with developer popularity numbers that mislead. This part is about the people those numbers leave out.
Every source has a door
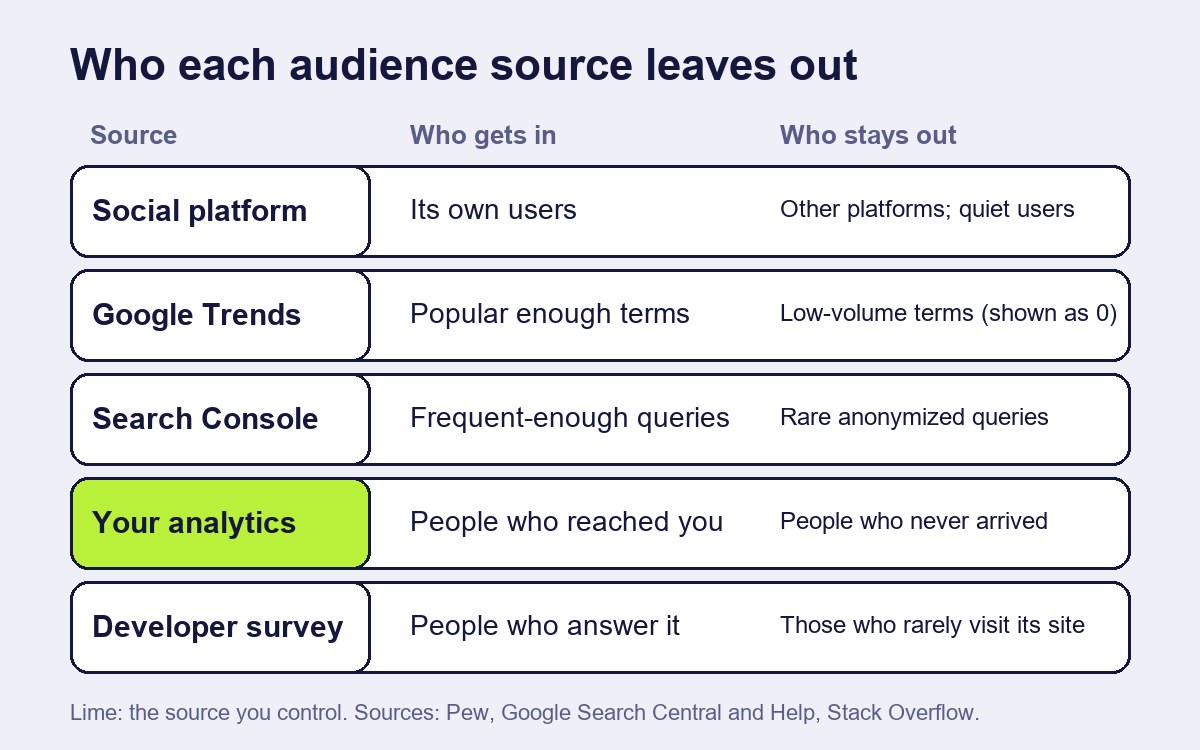
A signal reaches you only if someone passed through a door to produce it: they had an account, they posted, they searched often enough to be counted, they accepted a tracker. The table lists what the documentation and studies behind this article say about the doors of common sources.
| Source | Who gets in | Who or what stays out |
|---|---|---|
| A social platform | Users of that platform [1][2] | Everyone who does not use it; most users who rarely post [1] |
| Google Trends | A "largely unfiltered sample of actual search requests" [7] | Low-volume terms, shown as 0; repeat searches by one person in a short time [7] |
| Search Console queries | Queries with enough searchers | Anonymized queries, left out of the table rows [8] |
| Your web analytics | Visitors your site already reached | Anyone who never arrived; low-count rows that GA4 may withhold [9] |
| A developer survey | People who answer it | Developers who do not visit its host site often [10] |
The rest of this article goes through these doors one at a time.
A platform's users are not "the public"
Public discussion usually means one or two platforms, and no platform is a cross-section of society. The Pew Research Center's 2019 study of US Twitter users is a useful measurement because it compared users with the general population. Based on a probability panel of US adults, Pew reported that the median adult Twitter user was 40 years old against 47 for the median US adult, that 42% of Twitter users had at least a bachelor's degree against 31% of the public, and that 60% identified with or leaned towards the Democratic Party against 52% of US adults [1]. The differences are moderate, not extreme, and that is the point: a source can look ordinary and still lean in several directions at once.
Reach also differs by platform and by age. In Pew's survey of 5,511 US adults, fielded from January to June 2026, 18% said they use X and 25% Reddit, against 31% for LinkedIn and 84% for YouTube. Among adults aged 18 to 29, 31% use X; among those 65 and older, 7% do [2]. If your readers are not mainly American, or not mainly on one platform, the numbers will differ, and these figures describe US adults only. What carries over is the question to ask: a conversation on any single platform is a conversation among that platform's users.
Inside the platform, only a few people talk
Even among the people on a platform, speaking is uneven. Pew's 2019 study found that the 10% of US Twitter users who tweet most were responsible for 80% of the tweets created by US users, and that the median user tweeted about twice a month [1]. The reported mix of tweets was the loud minority's, not the typical user's.
This is an old pattern. In 2006 Jakob Nielsen described it as the 90-9-1 rule: 90% of users are lurkers who read but do not contribute, 9% contribute from time to time, and 1% "participate a lot and account for most contributions" [3]. His numbers for Wikipedia were more extreme: more than 99% of users were lurkers, and the most active 1,000 people, about 0.003% of users, made roughly two-thirds of the edits [3]. The article is two decades old and its ratios were an estimate of that moment, not a law. Treat it as the shape of the problem and use current platform data when you can get it.
If you collect questions from public threads, you are therefore sampling a small, active fraction of an already selected group. The things that fraction cares about may be real interests. They may also be the interests of people with time, confidence and a habit of arguing in public.
What researchers warn about
Researchers who use social media data have been raising this for years. In a 2014 Science policy forum, Derek Ruths and Jürgen Pfeffer open with the 1948 US election, when a newspaper headline named the wrong winner because telephone surveys had "inadvertently undersampled" one candidate's supporters [4]. They then describe a common assumption in social media studies: "that a large-enough sample of users will drown out noise introduced by peculiarities of the platform's population" [4]. Their reply is that "substantial population biases vary across different social media platforms", and that "these sampling biases are rarely corrected for (if even acknowledged)" [4]. One remedy on their checklist is to show results from more than one platform, or from time-separated datasets on the same platform [4].
Zeynep Tufekci's 2014 paper lists related problems in its abstract: over-emphasis of a single platform, Twitter; "sampling biases arising from selection by hashtags"; and "algorithmic invisibility", where user practices such as subtweeting or posting screenshots of text hide content from simple searches [5]. If you search a platform for a keyword, you find the people who typed it.
Eszter Hargittai's 2015 paper, using survey data, found that people do not join social network sites at random: use varies with age, gender, race and ethnicity, socioeconomic status, online experience and internet skills, which limits how far findings from these sites generalise [6].
None of these papers says social media data is worthless. They say size does not fix selection: a million posts from a narrow group is still a narrow group.
When the tool hides people for you
Some blind spots are built into analytics tools, usually for privacy.
Google Trends shows "a largely unfiltered sample of actual search requests", but "Trends only shows data for popular terms, so search terms with low volume appear as '0'" [7]. The same page says repeated searches by the same person over a short period are removed, and that searches made by Google's own products are excluded [7]. A zero in Trends therefore means "not enough searchers to show", not "nobody wants this". This is the situation the series described in Part 2, where narrow terms are the ones that disappear.
Search Console has a similar rule. Google's Search Central blog defines anonymized queries as "those that aren't issued by more than a few dozen users over a two-to-three month period" [8]. They are omitted from the tables, though they are included in chart totals unless you filter by query [8]. If you add up the visible query rows, you can end up below the total, and the missing part is exactly the rare, specific questions an audience-research project wants.
Google Analytics 4 applies data thresholds that withhold report data when it could reveal information about individual users, especially with demographic data and narrow date ranges. The thresholds are defined by the system and cannot be adjusted [9]. And your analytics, by construction, describe only people who found you. Someone who needed your topic and never reached your site does not appear in any report you can open.
The common lesson: when a tool removes small groups, the people it hides are the ones with the least common questions. For research aimed at finding questions that are not yet answered, that is a significant loss.
Even a good survey has a door
Surveys can reach people who never post, but they select too. The Stack Overflow Developer Survey 2025 reports "over 49,000+ responses from 177 countries" [10]. That is a large sample, yet the results page shows that the United States provides 20.4% of respondents, followed by Germany at 8.6% and India at 7.2% [10], and it reports that 82% of respondents visit the site at least a few times a month [10]. A developer who rarely uses Stack Overflow, or who works in a country with few respondents, has less chance of being counted. The survey is valuable. Its sample is "people who answer a survey from this site", and it is best read that way.
A short method: write down who is missing
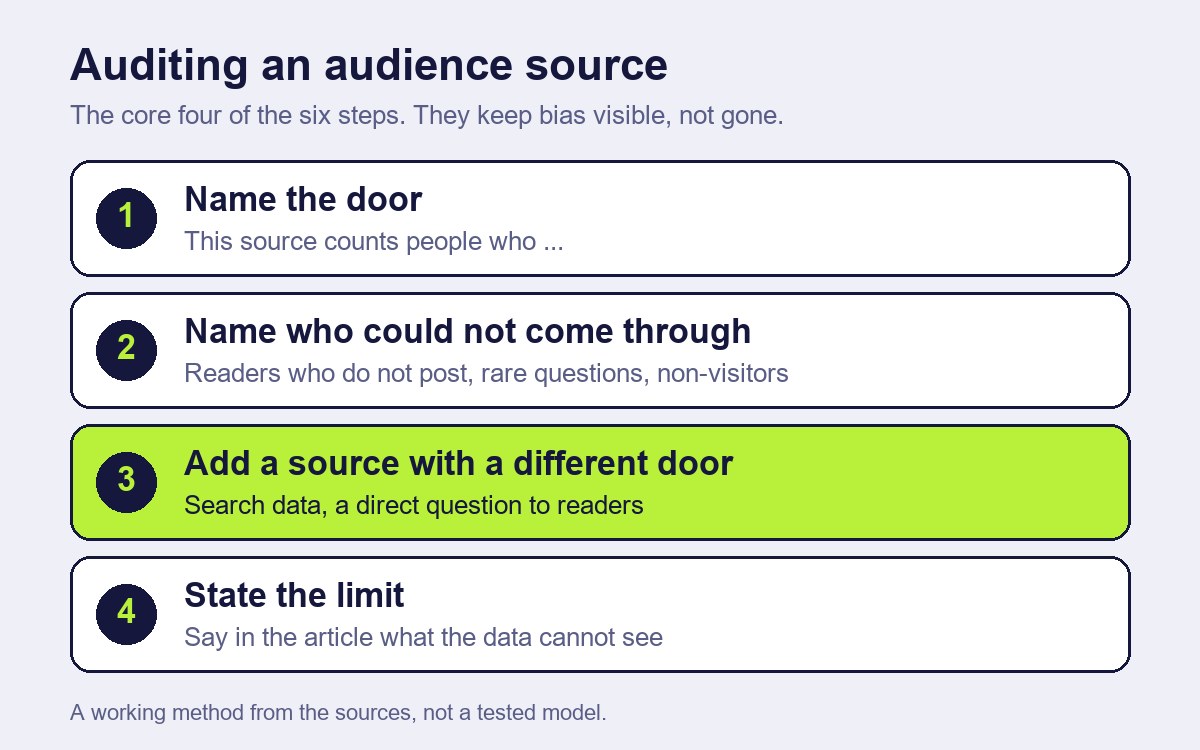
The steps below are a working method built from the sources above, not a tested model. They do not remove the bias. They keep it visible so you do not overclaim.
- Name the door. For each source, write one sentence: "This counts people who ___." For example, "people who post about this on X" or "people who search often enough to pass the Trends threshold" [7].
- Name who could not come through. List two or three groups your intended readers include but the source probably does not: people on other platforms, people who read but do not post [1][3], people with rare questions [8], people who never reached your site [9].
- Compare with a reference where one exists. If you know your readers' age range, platform habits or countries, check them against figures such as Pew's [1][2]. Where no reference exists, write "unknown" rather than guessing.
- Add a source with a different door. Match a public-discussion source with one that does not require posting: search data, a direct question to your readers, or a short survey you send yourself. Ruths and Pfeffer make the same point for platforms: show results from more than one [4]. Agreement between sources with different doors is stronger than volume in one.
- Do not read silence as absence. A topic nobody mentions in your data may be unmentioned because its audience is not there. Mark it "not observed", not "not wanted".
- State the limit in the article. A single line such as "This draws on public posts and Search Console queries; it does not cover readers who do not post" tells the reader what the finding is about.
A worked example (fictional)
The editor, the channels and every number in this section are invented to show the method.
An editor plans a guide to securing crypto wallets. Reading a public platform, she sees that most of the threads about wallet security are long and technical: hardware wallets, signing flows, seed phrase splitting. She is ready to write an advanced guide.
She runs the steps. The door of her source is "people who post about this on one platform", and by the studies above she expects that a small active share writes most of what she reads [1][3]. Who could not come through? Beginners who read and do not post. People who ask a search engine instead of a community. She checks Search Console and finds that in a three-month window the visible query rows add up to roughly half the clicks on the chart; the rest is hidden as anonymized queries [8]. She cannot see those queries. In the visible rows, though, the most frequent wording is basic: "how to back up a wallet", "what happens if I lose my phone".
She also sends a one-question form to her newsletter: "What is the one thing about wallet security you do not understand?" The replies are mostly basic too. The two sources have different doors and point the same way, and both differ from the public threads.
She writes the beginner guide first and adds a line near the top: "This guide draws on public posts, Search Console queries and replies from our own readers; it does not cover people who have never visited this site." The advanced guide goes on the list, with a note that its evidence came from one platform.
The numbers are invented. The point is the order of the work: say who is in the data, find a source with a different door, and say what is still not covered.
What this article cannot tell you
It cannot tell you who is missing from your audience. That depends on your readers, your platforms and your topic, and no general figure replaces looking. The Pew figures describe US adults and, for the 2019 Twitter study, users of that time; the 2006 Nielsen ratios are an old estimate; the Stack Overflow results come from the survey page, not from a study of its respondents' representativeness. I did not find a measured, independent estimate of how large the bias is for crypto or developer communities, and the six steps have not been tested experimentally. For Hargittai's 2015 paper I read the abstract only. The worked example is invented.
How this article was made
| Task | What the AI did | What a person did | How it was checked |
|---|---|---|---|
| Research | Collected and summarised sources on platform bias, participation inequality and analytics data limits | Chose the question and the sources to rely on | Figures and quotes checked against the Pew, Nielsen Norman Group, Google, arXiv, Science and Stack Overflow pages [1]–[10] |
| Draft | Wrote the first draft from the notes | Edited the text, the steps and the worked example | A separate review compared figures and claims with the sources |
| Images | Generated the woodblock cover illustration (from the Dapp.Expert cover library) | Chose the illustration; chose the diagram content; the diagrams were built in code | Labelled as AI-generated in the disclosure line and alt text |
| Not done by AI | — | The decision to publish and responsibility for the text | — |
Conflicts of interest: none. The author has no commercial relationship with Pew Research Center, Nielsen Norman Group, Google, Stack Overflow or the researchers named; the editor and the figures in the example are fictional.
Responsible for this article: Dmitriy Lastovka, author. Corrections: contact form.
Sources
Labels: official (the organisation's own page), paper (study, read via its official abstract or full text).
- Pew Research Center, "Sizing Up Twitter Users" (24 April 2019). https://www.pewresearch.org/internet/2019/04/24/sizing-up-twitter-users/ Official, full text.
- Pew Research Center, "Social Media Fact Sheet" (National Public Opinion Reference Survey, 5,511 US adults, 30 January to 18 June 2026). https://www.pewresearch.org/internet/fact-sheet/social-media/ Official.
- Jakob Nielsen, "The 90-9-1 Rule for Participation Inequality in Social Media and Online Communities", Nielsen Norman Group (8 October 2006). https://www.nngroup.com/articles/participation-inequality/ Official.
- Derek Ruths and Jürgen Pfeffer, "Social media for large studies of behavior", Science 346(6213), 1063–1064 (28 November 2014). https://doi.org/10.1126/science.1257756 Paper, full text (publisher PDF copy).
- Zeynep Tufekci, "Big Questions for Social Media Big Data: Representativeness, Validity and Other Methodological Pitfalls", ICWSM 2014, arXiv:1403.7400. https://arxiv.org/abs/1403.7400 Paper, official abstract.
- Eszter Hargittai, "Is Bigger Always Better? Potential Biases of Big Data Derived from Social Network Sites", The ANNALS of the American Academy of Political and Social Science 659(1), 63–76 (2015). https://doi.org/10.1177/0002716215570866 Paper, abstract via the RePEc record.
- Google Trends Help, "FAQ about Google Trends data". https://support.google.com/trends/answer/4365533 Official.
- Google Search Central Blog, "A deep dive into Search Console performance data filtering and limits" (19 October 2022). https://developers.google.com/search/blog/2022/10/performance-data-deep-dive Official.
- Google Analytics Help, "About data thresholds". https://support.google.com/analytics/answer/9383630 Official.
- Stack Overflow, "2025 Developer Survey". https://survey.stackoverflow.co/2025/ Official.