
AI tools helped gather research and write the first draft of this article. I edited it and checked every figure and quote against the source page listed at the end. The cover illustration is AI-generated. Details at the end.
Anyone who looks for topics to write about soon has two charts open. One is public: Google Trends, showing how interest in a term moves across everyone who searches. The other is private: the Performance report in Google Search Console, showing the searches in which your own site appeared.
Each answers half a question. Trends sees the market but not you. Search Console sees you but not the market. Read together, carefully, they can say something neither says alone: whether a topic is growing everywhere, growing only for you, or growing somewhere you are not yet visible.
This is the second part of Interest Radar, a series on finding questions worth researching. Part 1 dealt with telling a lasting trend from a short spike. This part is about putting a public trend line next to your own search data without fooling yourself, because the two numbers are built in very different ways.
Two instruments, two different numbers
Google Trends is built from "a largely unfiltered sample of actual search requests made to Google" [1]. Each point is divided by the total searches in that place and time range and then scaled from 0 to 100 [1]. It shows a share of interest, not a number of searches, and the scale is recalculated for each request. Google's own help page adds two cautions worth keeping in view: Trends "is not a scientific poll", and its data "should always be considered as one data point among others before drawing conclusions" [1].
Search Console counts something else. An impression is "how many times your site appeared in Search results", a click is a click from those results to your site, and average position is "the average position of the topmost result from your site" [2]. These are counts, and they are counts about you. A search in which your site did not appear does not exist in this report at all.
The differences go further than the units:
| Google Trends (website) | Search Console (Performance report) | |
|---|---|---|
| What it measures | Share of all searches for a term, scaled 0–100 for each request [1] | Impressions, clicks, CTR and position of your own site [2] |
| Who is in it | A sample of everyone searching on Google [1] | Only searches in which your site appeared [2] |
| Small numbers | Low-volume terms appear as 0 [1] | Rare (anonymized) queries are left out of the table but counted in chart totals [3][4] |
| Time zone | UTC for ranges of 30 days or longer; your browser's time zone for 7 days or less [1] | Pacific Time [5] |
| Delay | Not stated for the website; the Trends API runs up to about two days ago [6] | Usually 2–3 days; the newest data is preliminary [2][3] |
| History | Website: not compared here. API: a rolling window of 1,800 days (about five years) [6] | The last 16 months [7] |
| Size limits | Eight terms at a time in the website, according to Google's Trends API page [8] | Up to 1,000 rows in the interface; the API allows up to 50,000 rows per day per site per search type [3][4] |
Two rows in that table cause most of the trouble when the charts are combined: small numbers and who is in the data.
The blind spots on each side
Trends cannot see small topics. A narrow technical term often reads as a flat zero, which does not mean nobody searched [1]. The early, specific questions that a niche publication is best placed to answer are exactly the ones most likely to vanish. In practice you often have to compare a broader parent topic in Trends with the narrow queries you see in Search Console, and be honest that they are not the same thing.
Trends samples change between pulls. Marcelo Medeiros and Henrique Pires, in a 2021 paper on using Trends in forecasting models, point out that "each sample of Google search data is different from the other, even if you set the same search term, data and location" [9]. For anyone keeping a record, that means saving each export with its date instead of downloading the history again next month and assuming it will match.
Search Console cannot see where you are absent. Because it only counts searches in which your site appeared, a topic that is growing fast in the market but where you have no page, or rank too low to be shown, produces nothing in your report. Impressions are counted when a link is in the set of results the user loaded, even if it was not scrolled into view; a result on page three is not counted for a user who only looked at page one [10].
Search Console hides the long tail of rare queries. Google defines anonymized queries as those that "aren't issued by more than a few dozen users over a two-to-three month period" [4]. They count toward the chart totals but do not appear as rows, which is why the total can be higher than the sum of the table [3][4]. The newest, rarest phrasings of a question are the most likely to be in that hidden part.
Your own numbers move when you move. If a page rises from position 15 to position 5, its impressions can grow even if interest in the topic is flat, simply because more people now load a results page that contains it. A rise in impressions is only evidence of rising demand if position stayed roughly the same.
Lining the two up honestly
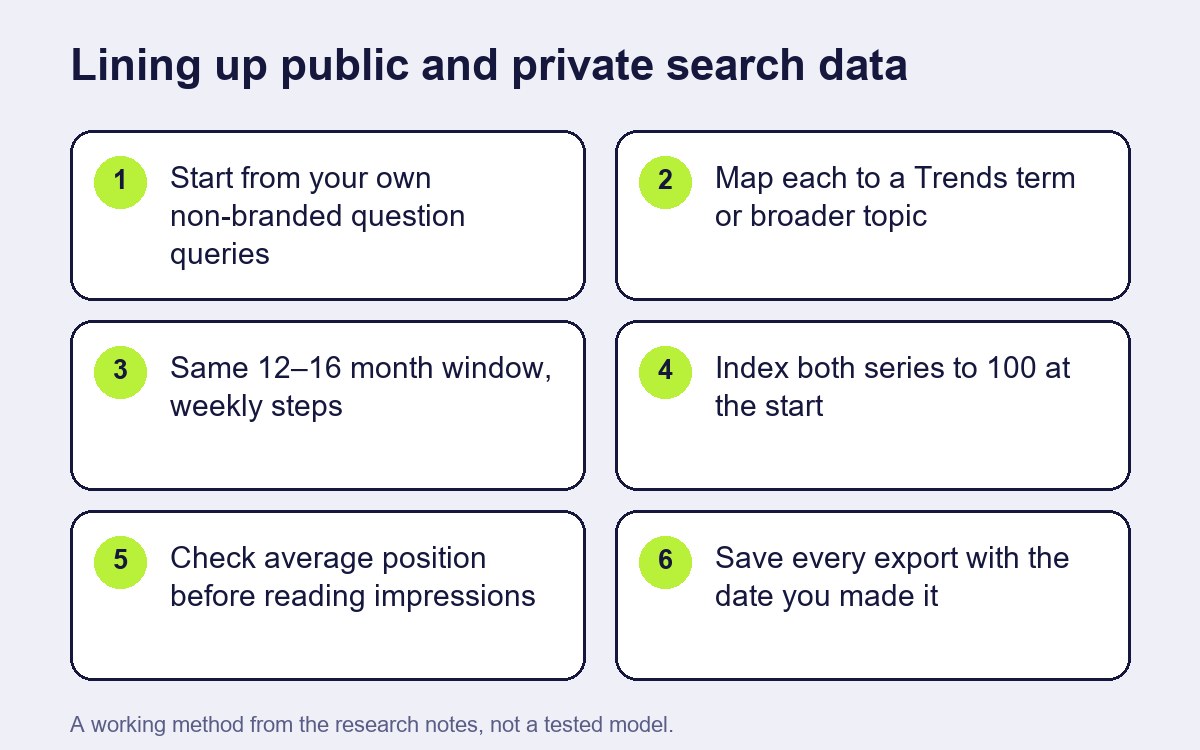
Because one series is a rescaled share and the other is a count, the two cannot be put on the same axis directly. What can be compared is direction and timing. The steps below are a working method drawn from the research behind this series, not a tested model.
- Start from your own questions. In Search Console, filter queries with a custom regular expression, an option added in 2021 [12]. Google's own example for question words is what|how|when|why, and the filter can also exclude matches [11]. A branded and non-branded filter, available since March 2025, separates searches that include your name from the rest, though it is not offered for sites with few impressions and Google warns that some queries may be classified wrongly [5]. Non-branded questions are the ones that tell you about the topic rather than about you.
- Map each question to a Trends term or topic. Use the closest term that Trends can actually show. If the narrow query reads as zero, use the broader topic and write down that you did so.
- Use the same window and weekly steps. Trends uses UTC for longer ranges and Search Console uses Pacific Time [1][5], so daily points from the two never line up exactly. Weekly totals over 12 to 16 months make the mismatch small and cover a full seasonal cycle, within the 16 months Search Console keeps [7].
- Index both to the same base. Divide each series by its own average over the first few weeks and multiply by 100. Both lines then start near 100, and you compare how they change, not how big they are.
- Check position before reading impressions. Look at average position for the same queries over the same weeks. If position improved sharply, set that period aside or treat the rise in impressions as mostly yours.
- Save dated exports. Keep each Trends download and each Search Console export with the date you made it. The Trends sample changes [9], and Search Console data older than 16 months is gone [7]. Your own archive becomes the record you will later use to judge which signals were early.
If you need many terms or automated pulls, Google opened a Trends API in July 2025 as an alpha for a limited set of testers [6][8]. Its data "don't reflect absolute numbers, they reflect search interest", but the scaling is consistent across requests, so separate pulls can be joined, and Google mentions merging Trends data "with their own systems" as a use case [6]. For most small sites, the website and a spreadsheet are enough.
Four combinations, four different stories
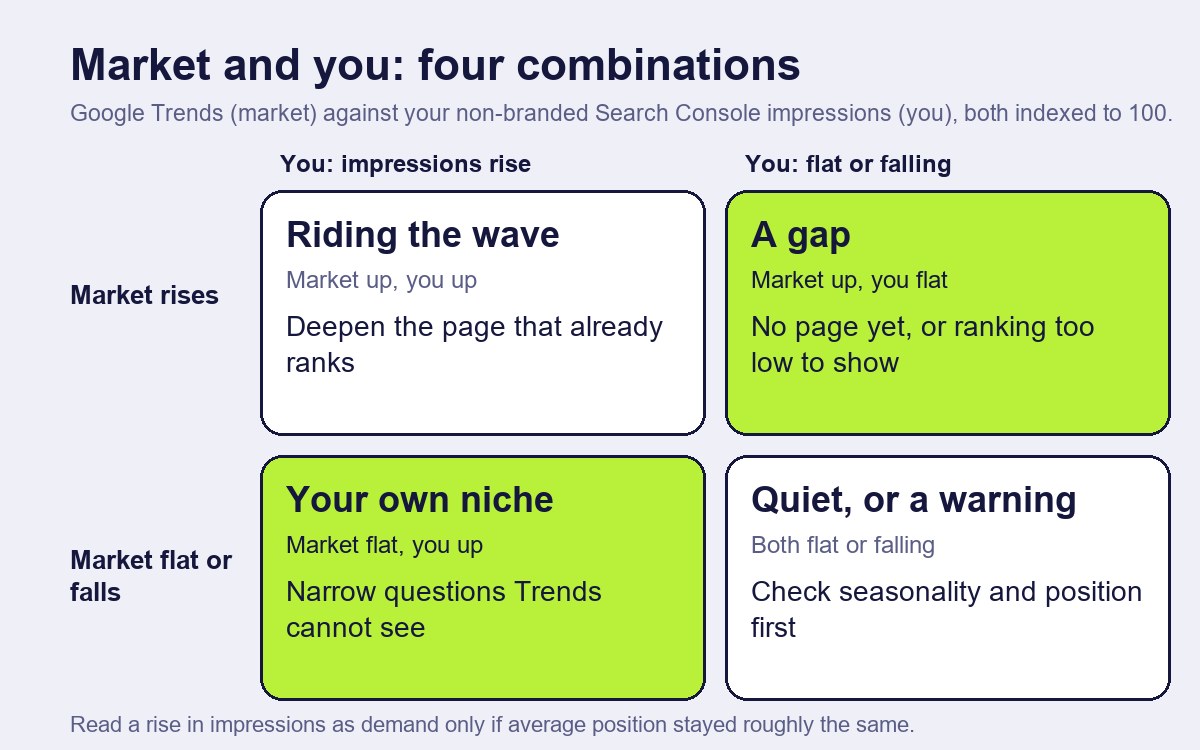
Once both series are indexed, each topic falls into one of four cases. Each is a reason to look closer, not a verdict.
| Your non-branded impressions rise (position stable) | Your impressions flat or falling | |
|---|---|---|
| Market interest rises (Trends) | Riding the wave. Interest is growing and you are visible. Deepen the page that already ranks and answer the follow-up questions. | A gap. The market moves without you. You may have no page on it, or rank too low to be shown. Check before writing a new piece. |
| Market interest flat or falling | Your own niche. Your readers search more than the market does. Often new, narrow questions that Trends cannot see. Strong candidates for a specialist article. | Quiet, or a warning. Compare with the same weeks last year for seasonality, and check whether position changed, before concluding interest is fading. |
The "gap" and "your own niche" cases are the useful ones for finding topics. The gap tells you the wider audience is asking something you do not yet answer. The niche case tells you your particular readers are ahead of the general public, or asking in words too narrow for Trends to show. That is where the first part of this series becomes relevant again: before acting on either, wait a cycle and look for a second, independent type of signal.
Mistakes that are easy to make
- Reading the Trends 0–100 value as volume. A value of 100 means the peak share within that request, not a fixed number of searches [1]. Two downloads with different comparison terms can give the same week different values.
- Adding up table rows. The Search Console table leaves out anonymized queries and is capped at 1,000 rows in the interface [3][4]. For topic research, the direction of the rows you can see matters more than their sum.
- Treating fresh data as final. The latest Search Console days can be preliminary and change [2]; leave the last few days out of any comparison.
- Ignoring your own changes. A new page, a redesign or a change of title can move impressions in a way that has nothing to do with demand. Keep a short log of what you changed and when.
- Sending private data to outside tools. Your Search Console queries are your readers' searches. If you use outside AI tools or services to help with the analysis, consider sending them only the public topic terms, not the raw export.
A worked example (fictional)
The site, the topic and the figures in this section are invented to show the method.
A small site writes about crypto wallets. Its question filter in Search Console shows a set of non-branded queries such as "how to recover a smart wallet" and "what is a passkey wallet". Over eight weeks, impressions for this group, indexed to 100 at the start, rise to about 180. Average position for the same queries stays between 9 and 11.
The narrow phrases read as zero in Trends, so the editor compares a broader term for passkeys. Over the same weeks, its indexed Trends line moves only from 100 to about 110.
That puts the topic in the "your own niche" box: the site's readers are asking more than the general public is. Position did not change, so the rise is not simply better ranking. The editor saves both exports with the date and looks for a second signal: a few new open issues about passkey recovery in an open-source wallet library point the same way.
The decision is to write a specialist explainer that answers the recovery questions directly, rather than a general "passkeys are coming" piece. If, four weeks later, the market line in Trends begins to rise too, the site will already have the page that answers the more specific questions.
What this article cannot tell you
It cannot tell you that either source leads the other. No independent study measuring how far Search Console or Trends runs ahead of wider interest was found in the research behind this series, and the six steps and four combinations have not been tested experimentally. The help pages describe how the tools work today; Google can change thresholds, filters and limits. The branded query filter is new and, by Google's own account, sometimes wrong [5]. The worked example is invented.
How this article was made
| Task | What the AI did | What a person did | How it was checked |
|---|---|---|---|
| Research | Collected sources on Google Trends, Search Console and their limits into research notes | Chose the question and the sources to rely on | Figures and quotes checked against Google's help pages, the Search Central Blog and the paper's official abstract [1]–[12] |
| Draft | Wrote the first draft from the notes | Edited the text, the steps and the worked example | A separate review compared figures and claims with the sources |
| Images | Generated the cover photograph-style illustration | Chose the illustration; designed the explanatory diagrams | Labelled as AI-generated in the disclosure line and alt text |
| Not done by AI | — | The decision to publish and responsibility for the text | — |
Conflicts of interest: none. The author has no commercial relationship with Google or the researchers named; the site and topic in the example are fictional.
Responsible for this article: Dmitriy Lastovka, author. Corrections: contact form.
Sources
Labels: official (the organisation's own page), paper (study, read via its official abstract).
- Google Trends Help, "FAQ about Google Trends data". https://support.google.com/trends/answer/4365533 Official.
- Search Console Help, "Performance report (Search results): Overview and basic setup". https://support.google.com/webmasters/answer/7576553 Official.
- Search Console Help, "About Search Console data" (data delay, 1,000-row tables, chart totals). https://support.google.com/webmasters/answer/96568 Official.
- Daniel Waisberg, "A deep dive into Search Console performance data filtering and limits", Google Search Central Blog (19 October 2022). https://developers.google.com/search/blog/2022/10/performance-data-deep-dive Official.
- Search Console Help, "Performance report (Search results): Dimensions and data groupings" (Pacific Time, branded queries filter). https://support.google.com/webmasters/answer/17011259 Official.
- Daniel Waisberg, Hadas Jacobi, "Introducing the Google Trends API (alpha): a new way to access Search Trends data", Google Search Central Blog (24 July 2025). https://developers.google.com/search/blog/2025/07/trends-api Official.
- Google Analytics Help, "[GA4] Queries report" ("Search Console keeps data for the last 16 months"). https://support.google.com/analytics/answer/13682862 Official.
- Google Search Central, "Google Trends API (alpha)" (five-year window; the website compares up to eight terms). https://developers.google.com/search/apis/trends Official.
- Marcelo C. Medeiros, Henrique F. Pires, "The Proper Use of Google Trends in Forecasting Models", arXiv:2104.03065 (2021). https://arxiv.org/abs/2104.03065 Paper (preprint), official abstract.
- Search Console Help, "What are impressions, position, and clicks?". https://support.google.com/webmasters/answer/7042828 Official.
- Daniel Waisberg, "Search Console regex filters update and quick tips", Google Search Central Blog (2 June 2021). https://developers.google.com/search/blog/2021/06/regex-negative-match Official.
- Ziv Hodak, "Improved data filtering and comparison on Performance reports", Google Search Central Blog (7 April 2021). https://developers.google.com/search/blog/2021/04/performance-report-data-filtering Official.