
AI tools helped gather research and write the first draft of this article. I edited it and checked every figure and quote against the source page listed at the end. The cover illustration is AI-generated. Details at the end.
When a new developer tool appears, the first numbers anyone quotes are public counters: stars on GitHub, weekly downloads on npm or PyPI, downloads on Hugging Face. They are free, they update every day, and they look like a direct measure of how many developers care.
They are not. Each counter measures something narrower than "people use this": a bookmark, a file request, a visit. Some can be bought, some are inflated by machines doing their normal work, and some move because the platform itself changed. None of this makes them useless. It means each one has to be read for what it actually counts.
This is the third part of Interest Radar, a series on finding questions worth researching. Part 1 dealt with telling a lasting trend from a short spike, and Part 2 with putting public search trends next to your own search data. This part is about the "builder" signals that developers leave behind, and how they mislead.
What each number actually counts
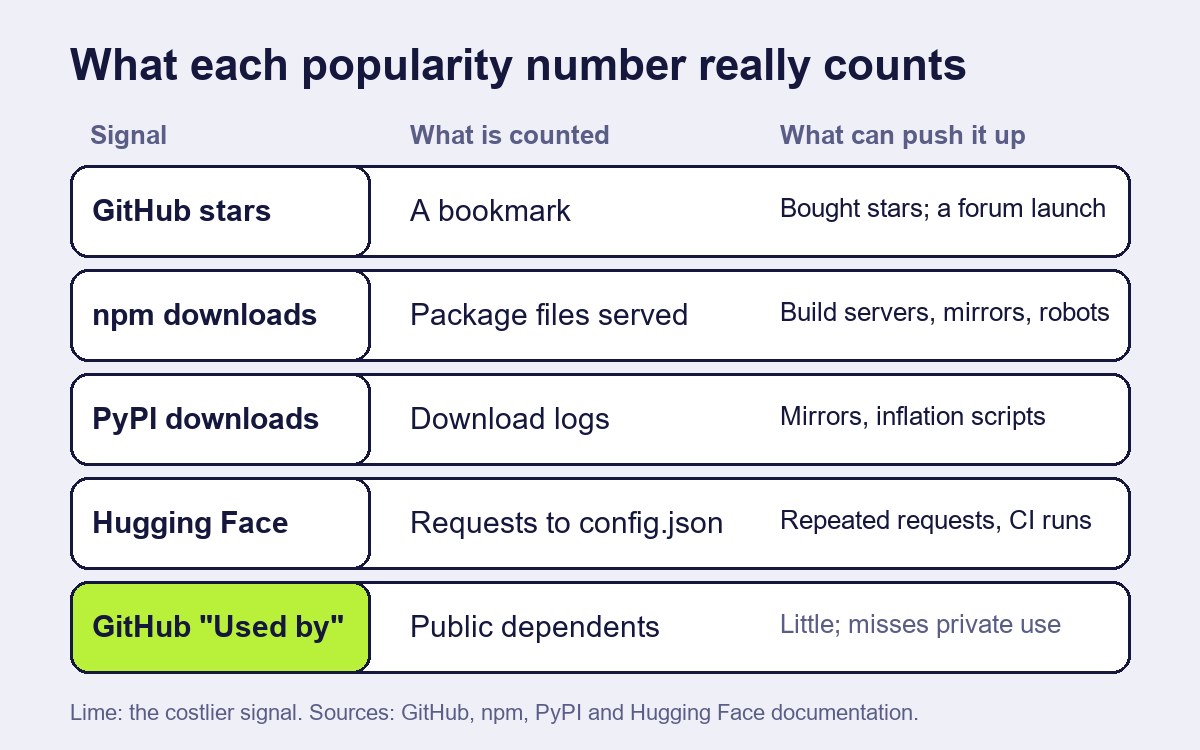
| Signal | What is counted | What can push it up without more users |
|---|---|---|
| GitHub stars | A user saving a repository; GitHub describes it as a bookmark and a way to show appreciation [1] | Purchased or automated stars [2][3]; a launch on a busy forum [5] |
| npm downloads | HTTP 200 responses for package tarballs, crunched once a day after UTC midnight [6][7] | Build servers, mirrors and robots that download every package [7] |
| PyPI downloads | Download logs streamed to a public BigQuery dataset; PyPI does not show counts on project pages [8] | Mirrors, scripts and "attempts at download count inflation"; pip's cache pushes counts down [8] |
| Hugging Face model downloads | Every GET or HEAD request to a set of query files, by default config.json [9] | Repeated automated requests; excluding CI/CD downloads needs separate publisher logs [9] |
| GitHub "Used by" | Public repositories that depend on a package, shown only when more than 100 depend on it [10] | Little; but private projects are invisible, so it undercounts [10] |
| Stack Overflow activity | Visits and questions on the site | Falls when developers ask somewhere else, not only when interest drops [11] |
The rest of this article goes through the rows that cause most of the mistakes.
Stars: a bookmark that matters, so it gets bought
GitHub's own help page is plain about what a star is: "Starring makes it easy to find a repository or topic again later", and it "also shows appreciation to the repository maintainer" [1]. The same page explains why stars matter beyond the person who clicks: "Many of GitHub's repository rankings depend on the number of stars a repository has", and Explore "shows popular repositories based on the number of stars they have" [1].
People do look at them. In a survey by Hudson Borges and Marco Tulio Valente, published in 2018, "three out of four developers consider the number of stars before using or contributing to a GitHub project" [4]. The same paper warns about "the risks faced when selecting projects by GitHub stars" [4].
When a number drives rankings and decisions, someone will try to manufacture it. GitHub's Acceptable Use Policies prohibit "rank abuse, such as automated starring or following" [2]. The rule exists because the practice does. A study by Hao He and colleagues, titled Six Million (Suspected) Fake Stars in GitHub, built a detector called StarScout and ran it over GitHub activity from 2019 to 2024 [3]. In its introduction the paper reports "6.0 million fake stars and 18,617 repositories with fake star campaigns" [3]. The activity "started to gain momentum in 2022 and have surged in 2024", and in July 2024 the authors flagged campaigns in 16.66% of the repositories that gained at least 50 stars that month [3].
Three details from that study are useful for anyone reading star counts:
- Fake stars are a small share of all stars, but a large share of some repositories. Across GitHub they stay at or below about 1% of stars each month [3]. The problem is concentrated: a repository with a campaign can owe much of its count to it.
- They leave a recognisable trace. One signature StarScout looks for is accounts with "only one WatchEvent" (a star) "plus at most one additional event" in the same repository on the same day [3]. Another is groups of accounts that star the same set of repositories together [3]. The authors stress that these are suspected, not confirmed, fake stars.
- The effect is short. Fake stars "may help a repository gain real attention in the short term (i.e., less than two months)", the effect is "about 5x smaller than that of real stars", and in the long term "the history of faking stars becomes a liability" [3].
The authors' conclusion is the one to keep: "star counts should not be used for high-stakes decisions by themselves" [3]. They also note that stars do not correlate highly with downloads and installations, citing an earlier study [3].
Real stars can mislead too
Not every misleading jump is fake. A launch on a busy forum produces a real burst of stars that says more about the launch than about lasting use. Obada Kraishan tracked 138 launches of AI and LLM tools on Hacker News in 2024–2025 and found average gains of about 121 stars in 24 hours, 189 in 48 hours and 289 within a week [5]. The paper reports that "Posting timing appears as key factor", and that the "Show HN" label "shows no statistical advantage after controlling for other factors" [5]. It is a single study without replication, but the pattern is the one Part 1 of this series warned about: a spike tied to one event, not yet a trend.
A star is also a cheap action. Saving a repository to read later is exactly what GitHub designed it for [1]. A large count can mean many people intend to look, not that many people run the code.
Downloads count requests, not people
Package downloads look harder to fake, because they come from real installs. But a download is a server log line, not a person.
npm says so directly. A 2014 post on the npm blog explains that download counts "are simply a count of the number of HTTP 200 responses we served that were tarball files, i.e. packages" [7]. The same post lists what is in that number: "automated build servers", "downloads by mirrors" and "robots that download every package for analysis" [7]. Some of this is limited by caching (a mirror fetches each version once, and repeat installs on your own machine usually come from the local cache), but disposable virtual machines and Docker containers are named as exceptions [7]. The current registry documentation adds the mechanics: counts are computed "Once per day, soon after UTC midnight", per-version counts are "only available for the previous 7 days", and most queries are limited to 18 months of data [6].
PyPI goes further and does not show download counts on project pages at all. The Python Packaging User Guide calls the numbers "Highly inaccurate" and lists why: pip's download cache lowers them, internal or unofficial mirrors "can both raise or lower download counts", and "Unofficial scripts or attempts at download count inflation" raise them [8]. It adds a point that applies to every row of the table above: "Just because a project has been downloaded a lot doesn't mean it's good" [8]. Anyone who wants the raw numbers can query the public BigQuery dataset that PyPI's logs are streamed to [8].
Hugging Face counts model downloads by watching a few "query files". "Every HTTP request to these files, including GET and HEAD, will be counted as a download", and by default the file is config.json [9]. That avoids counting each shard of a large model separately, but it also means a script that checks a model's config on every run adds a download each time. Hugging Face offers organisations more granular logs precisely so they can "exclude downloads from CI/CD pipelines" or "deduplicate users" [9]. The documentation describes no such filtering for the public count.
Two practical consequences follow. First, download counts from different registries are built differently and should not be compared with each other. Second, within one registry, a sudden rise is worth checking against releases and against the size of the projects that depend on the package, because a single large project with frequent automated builds can add a great deal of volume.
When the platform itself changes
Some developer signals fall for reasons that have nothing to do with the technology being discussed. Stack Overflow activity has long been used as a rough measure of interest in languages and tools. Gordon Burtch, Dokyun Lee and Zhichen Chen, writing in Scientific Reports in 2024, estimated that after ChatGPT's release "Stack Overflow's daily web traffic has declined by approximately 1 million individuals per day", about 12% of its daily traffic just before the release, and that question volumes per topic "have declined markedly" [11]. They "observed no evidence that ChatGPT has had any effects on user engagement at Reddit" [11].
The lesson for topic research is general. A falling count of questions about a tool can mean developers lost interest, or that they now ask an AI assistant instead. A rising count of downloads can mean more users, or a change in how build systems fetch packages. Before reading a long-term line, ask whether the place that produces it changed during the period.
A cross-check before you trust a popularity number
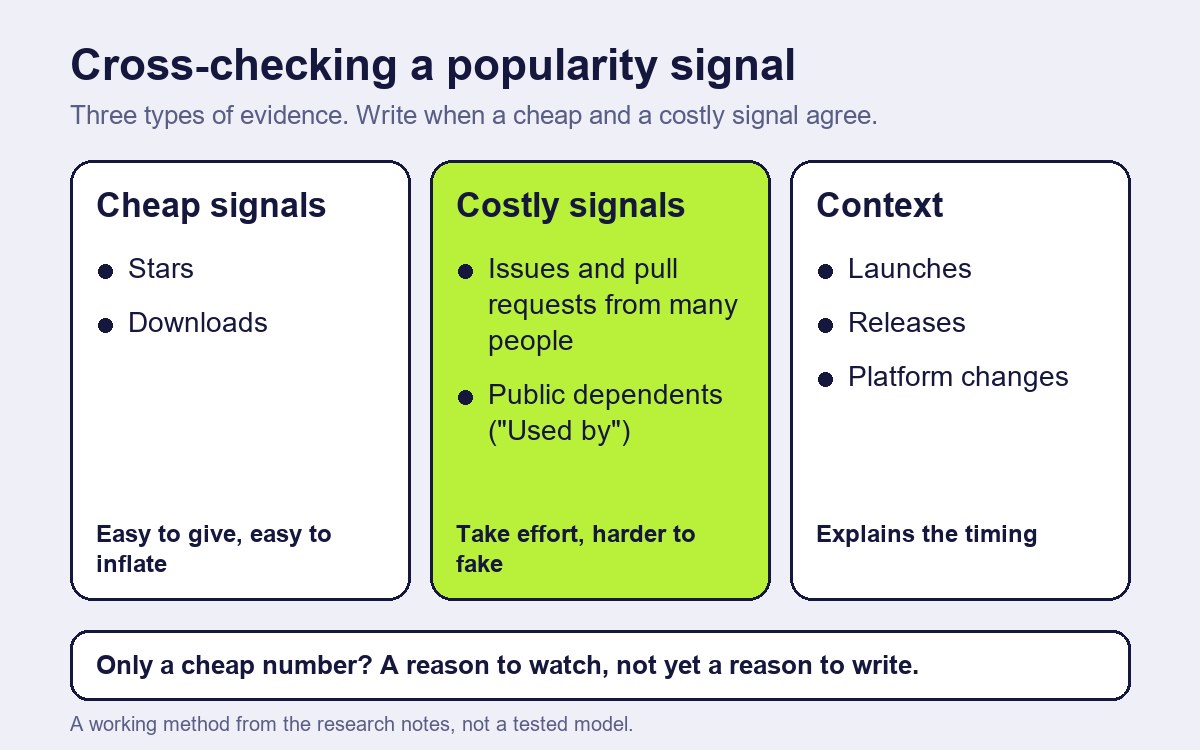
The steps below are a working method drawn from the research behind this series, not a tested model. The aim is not to prove a number wrong, but to see whether different kinds of evidence point the same way.
- Name what the number counts. Write it down in plain words: "bookmarks", "tarball responses", "requests to config.json". This alone removes most overreading.
- Look at the shape of the growth, not the total. A month in which a repository gains far more stars than usual deserves a look at who starred it. Many new accounts with no other activity are the low-activity pattern the fake-star study describes [3]. A jump in the days after a forum launch is a launch effect [5].
- Find a second signal of a different type. Stars and downloads are cheap actions. Issues and pull requests from many different people, or public dependents in GitHub's "Used by" section [10], take more effort. The fake-star study notes that some users look at issues and pull requests before starring, as signs of an active project [3]. Agreement between a cheap and a costly signal is worth more than a large cheap number.
- Compare like with like. Compare npm with npm and PyPI with PyPI, over the same weeks, and line up rises with release dates. Do not set npm downloads against PyPI downloads or Hugging Face counts [7][8][9].
- Check whether the platform changed. A new ranking rule, a new client that fetches more files, or a migration of developers to other tools [11] can bend a long series.
- Keep dated notes. npm keeps per-version counts for only seven days and returns at most 18 months for most queries [6]. If you want to judge later which signal was early, you need your own record of what you saw and when.
If the second signal of a different type is missing, treat the topic as a reason to watch, not yet a reason to write.
A worked example (fictional)
The library, the figures and the editor's decision in this section are invented to show the method.
An editor sees a wallet-connection library for web apps climb from 1,200 to 9,800 stars in five weeks. A social post calls it "the fastest-growing wallet library of the year". Before writing about it, the editor goes through the six steps.
The star history shows most of the gain in a single week. In a sample of the accounts that starred it that week, many were created recently, have no repositories of their own, and starred nothing else on that day. That matches the low-activity pattern, though it does not prove anything on its own. The library's weekly npm downloads are steady at around 3,000, with no change during the star jump. There are eight open issues, most from the same two people, and the repository has no "Used by" section, which GitHub shows only above 100 public dependents.
Compare a second library in the same field. Its stars rose more slowly, from 900 to 1,600 over three months, but its weekly downloads doubled after a release, and new issues came from dozens of different people asking how to recover sessions on mobile.
The editor writes about the second library's topic, mobile session recovery, and does not mention the first. The star count was the loudest number on the page, and the least informative.
What this article cannot tell you
It cannot tell you whether a particular repository bought stars: the fake-star study reports suspected campaigns found by a classifier, and its authors say it may include false positives [3]. It cannot give a threshold at which star growth becomes suspicious, or a share of downloads that comes from automation; no such figures were found in the sources. The launch study covers one forum and one kind of tool [5]. No independent study was found showing that any of these signals leads wider adoption by a measured amount. The six steps have not been tested experimentally. The worked example is invented.
How this article was made
| Task | What the AI did | What a person did | How it was checked |
|---|---|---|---|
| Research | Collected sources on GitHub stars, package download counts and developer platforms into research notes | Chose the question and the sources to rely on | Figures and quotes checked against GitHub Docs, npm and Python packaging docs, Hugging Face docs and the papers [1]–[11] |
| Draft | Wrote the first draft from the notes | Edited the text, the steps and the worked example | A separate review compared figures and claims with the sources |
| Images | Generated the cover photograph-style illustration | Chose the illustration; designed the explanatory diagrams | Labelled as AI-generated in the disclosure line and alt text |
| Not done by AI | — | The decision to publish and responsibility for the text | — |
Conflicts of interest: none. The author has no commercial relationship with GitHub, npm, the Python Software Foundation, Hugging Face, Stack Overflow or the researchers named; the libraries in the example are fictional.
Responsible for this article: Dmitriy Lastovka, author. Corrections: contact form.
Sources
Labels: official (the organisation's own page), paper (study, read via its official abstract or full text).
- GitHub Docs, "Saving repositories with stars". https://docs.github.com/en/get-started/exploring-projects-on-github/saving-repositories-with-stars Official.
- GitHub Docs, "GitHub Acceptable Use Policies" (section on spam and inauthentic activity). https://docs.github.com/en/site-policy/acceptable-use-policies/github-acceptable-use-policies Official.
- Hao He, Haoqin Yang, Philipp Burckhardt, Alexandros Kapravelos, Bogdan Vasilescu, Christian Kästner, "Six Million (Suspected) Fake Stars in GitHub: A Growing Spiral of Popularity Contests, Spams, and Malware", arXiv:2412.13459 (v2, 6 September 2025). https://arxiv.org/abs/2412.13459 Paper (preprint), full text.
- Hudson Borges, Marco Tulio Valente, "What's in a GitHub Star? Understanding Repository Starring Practices in a Social Coding Platform", Journal of Systems and Software 146 (2018), arXiv:1811.07643. https://arxiv.org/abs/1811.07643 Paper, official abstract.
- Obada Kraishan, "Launch-Day Diffusion: Tracking Hacker News Impact on GitHub Stars for AI Tools", arXiv:2511.04453 (2025). https://arxiv.org/abs/2511.04453 Paper (preprint), official abstract.
- npm registry documentation, "download-counts". https://github.com/npm/registry/blob/main/docs/download-counts.md Official.
- npm blog, "numeric precision matters: how npm download counts work" (22 July 2014). https://blog.npmjs.org/post/92574016600/numeric-precision-matters-how-npm-download-counts-work Official.
- Python Packaging User Guide, "Analyzing PyPI package downloads". https://packaging.python.org/en/latest/guides/analyzing-pypi-package-downloads/ Official.
- Hugging Face Hub documentation, "Models Download Stats". https://huggingface.co/docs/hub/models-download-stats Official.
- GitHub Docs, "About the dependency graph" (dependents and the "Used by" section). https://docs.github.com/en/code-security/supply-chain-security/understanding-your-software-supply-chain/about-the-dependency-graph Official.
- Gordon Burtch, Dokyun Lee, Zhichen Chen, "The consequences of generative AI for online knowledge communities", Scientific Reports 14, 10413 (2024). https://pmc.ncbi.nlm.nih.gov/articles/PMC11074245/ Paper, full text.